Current Las Vegas Market Individual Charts
Current Las Vegas Market Report
Market Overview
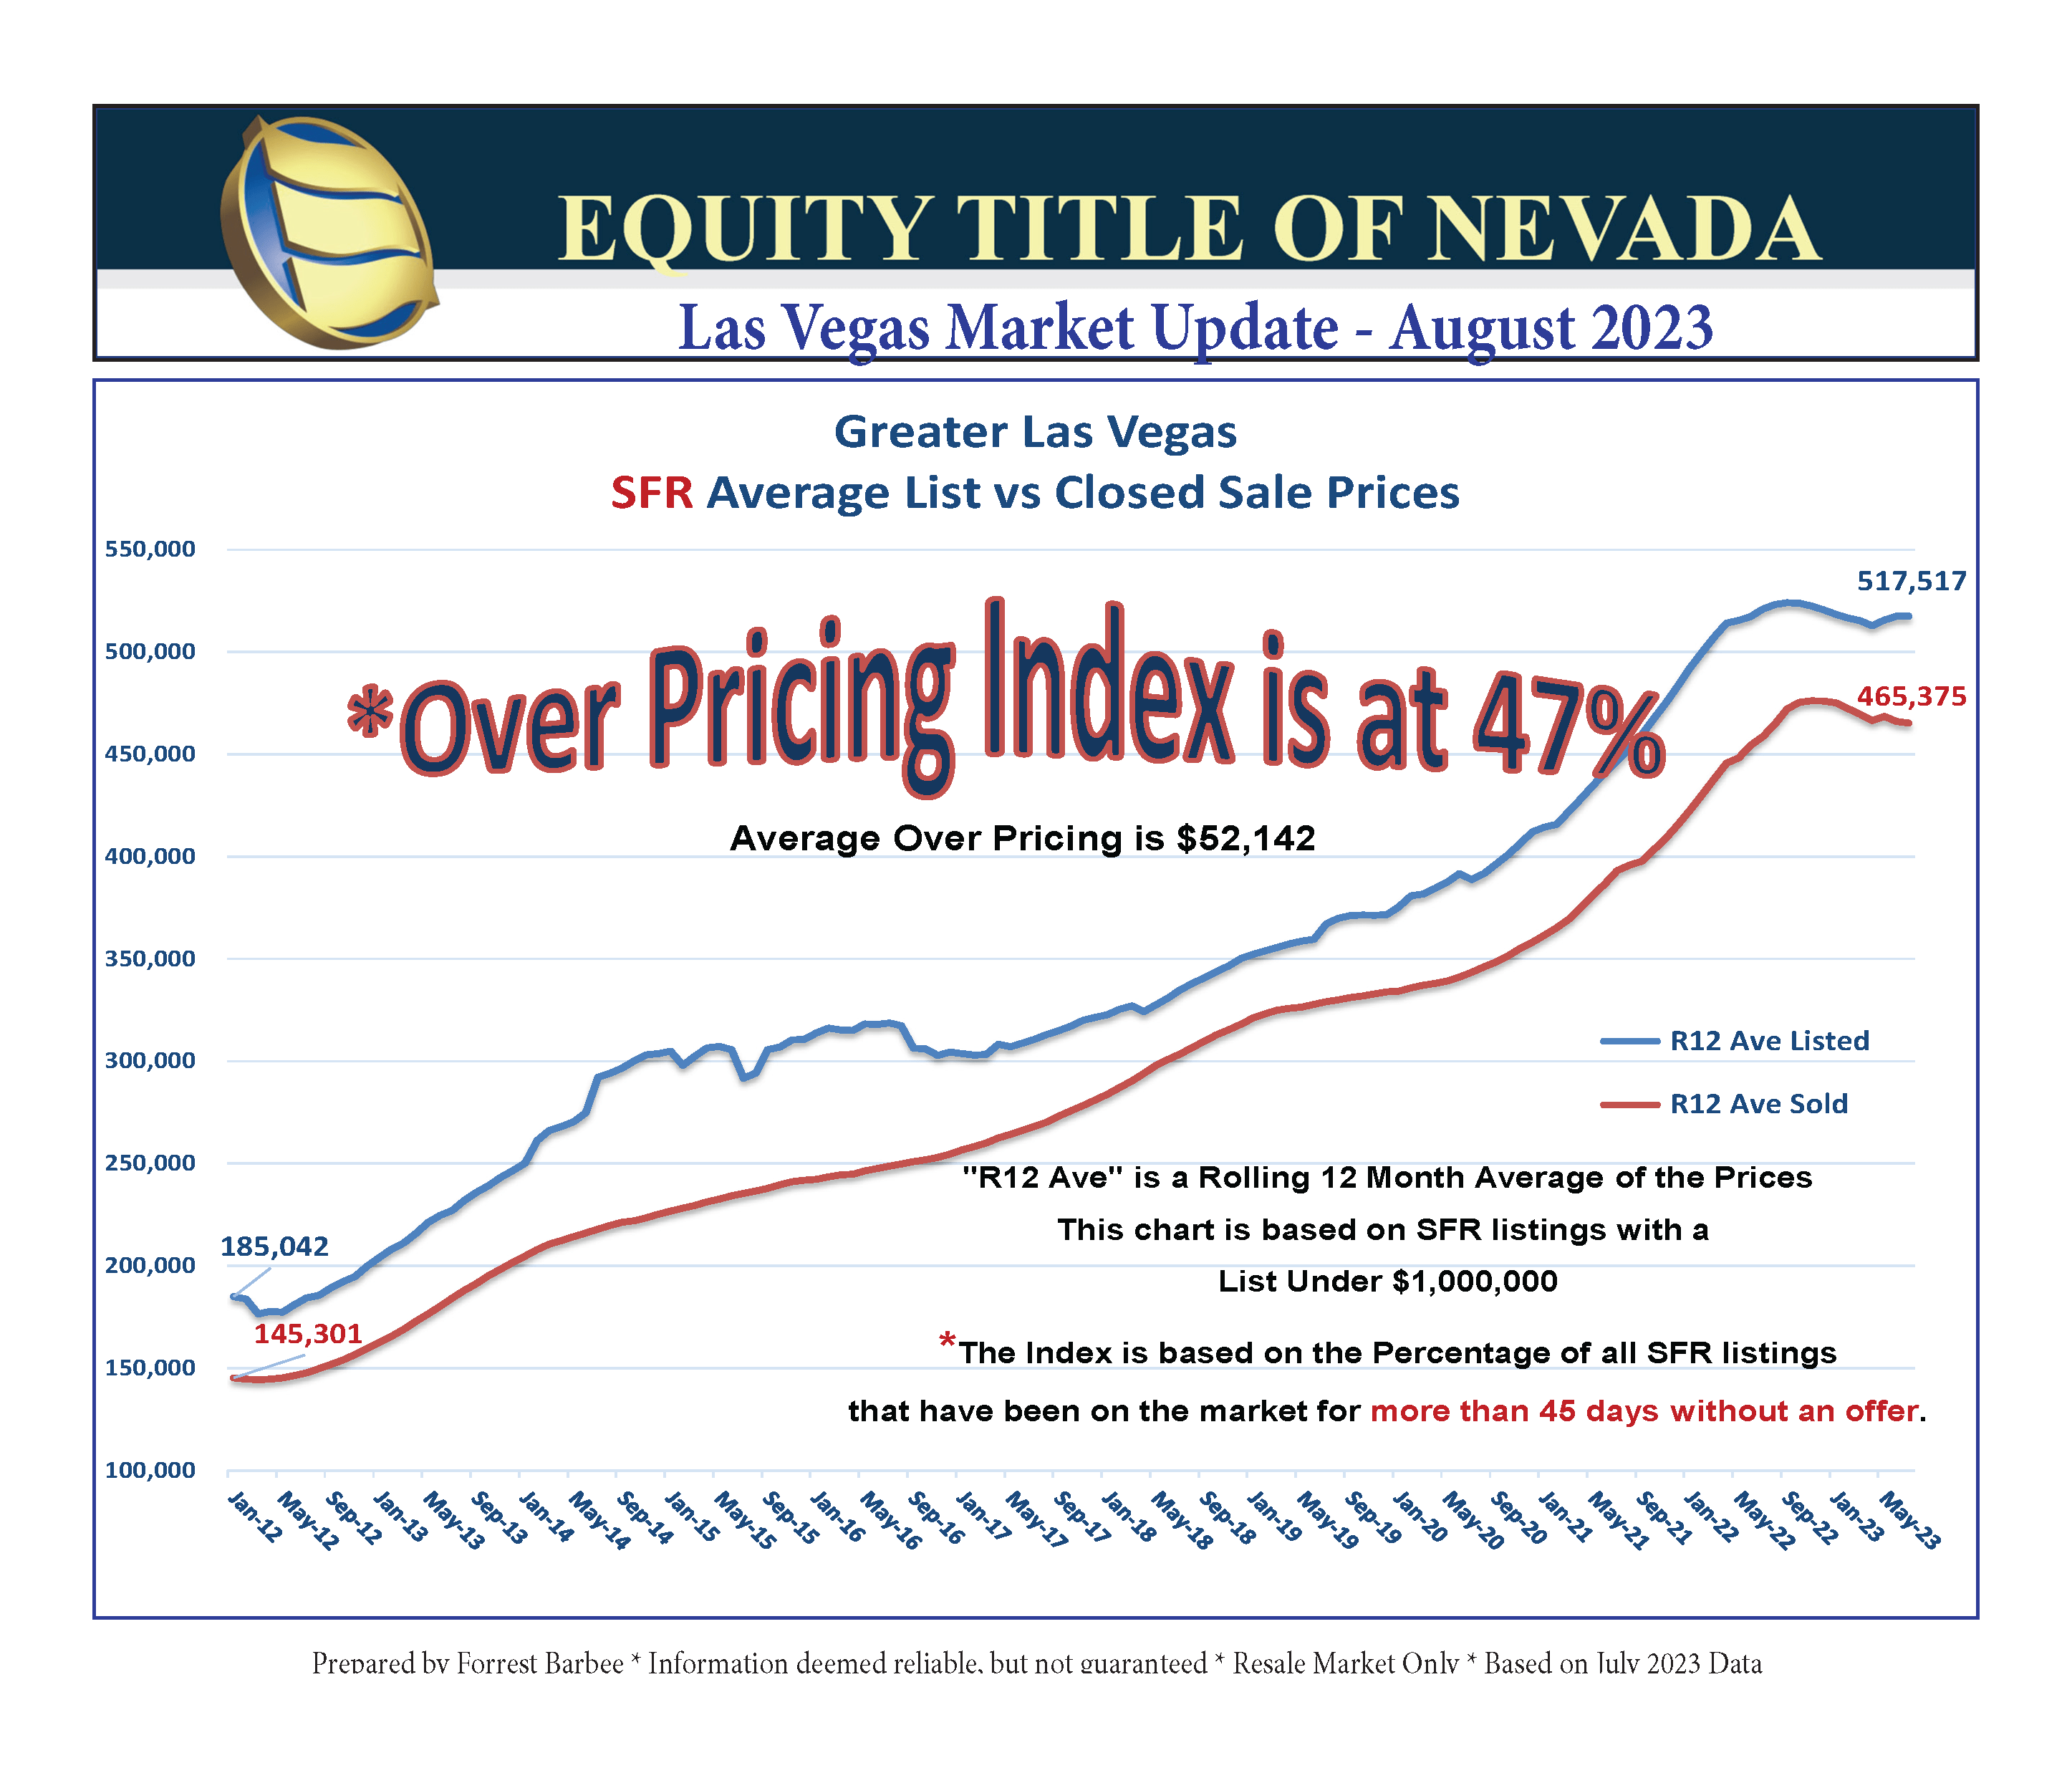
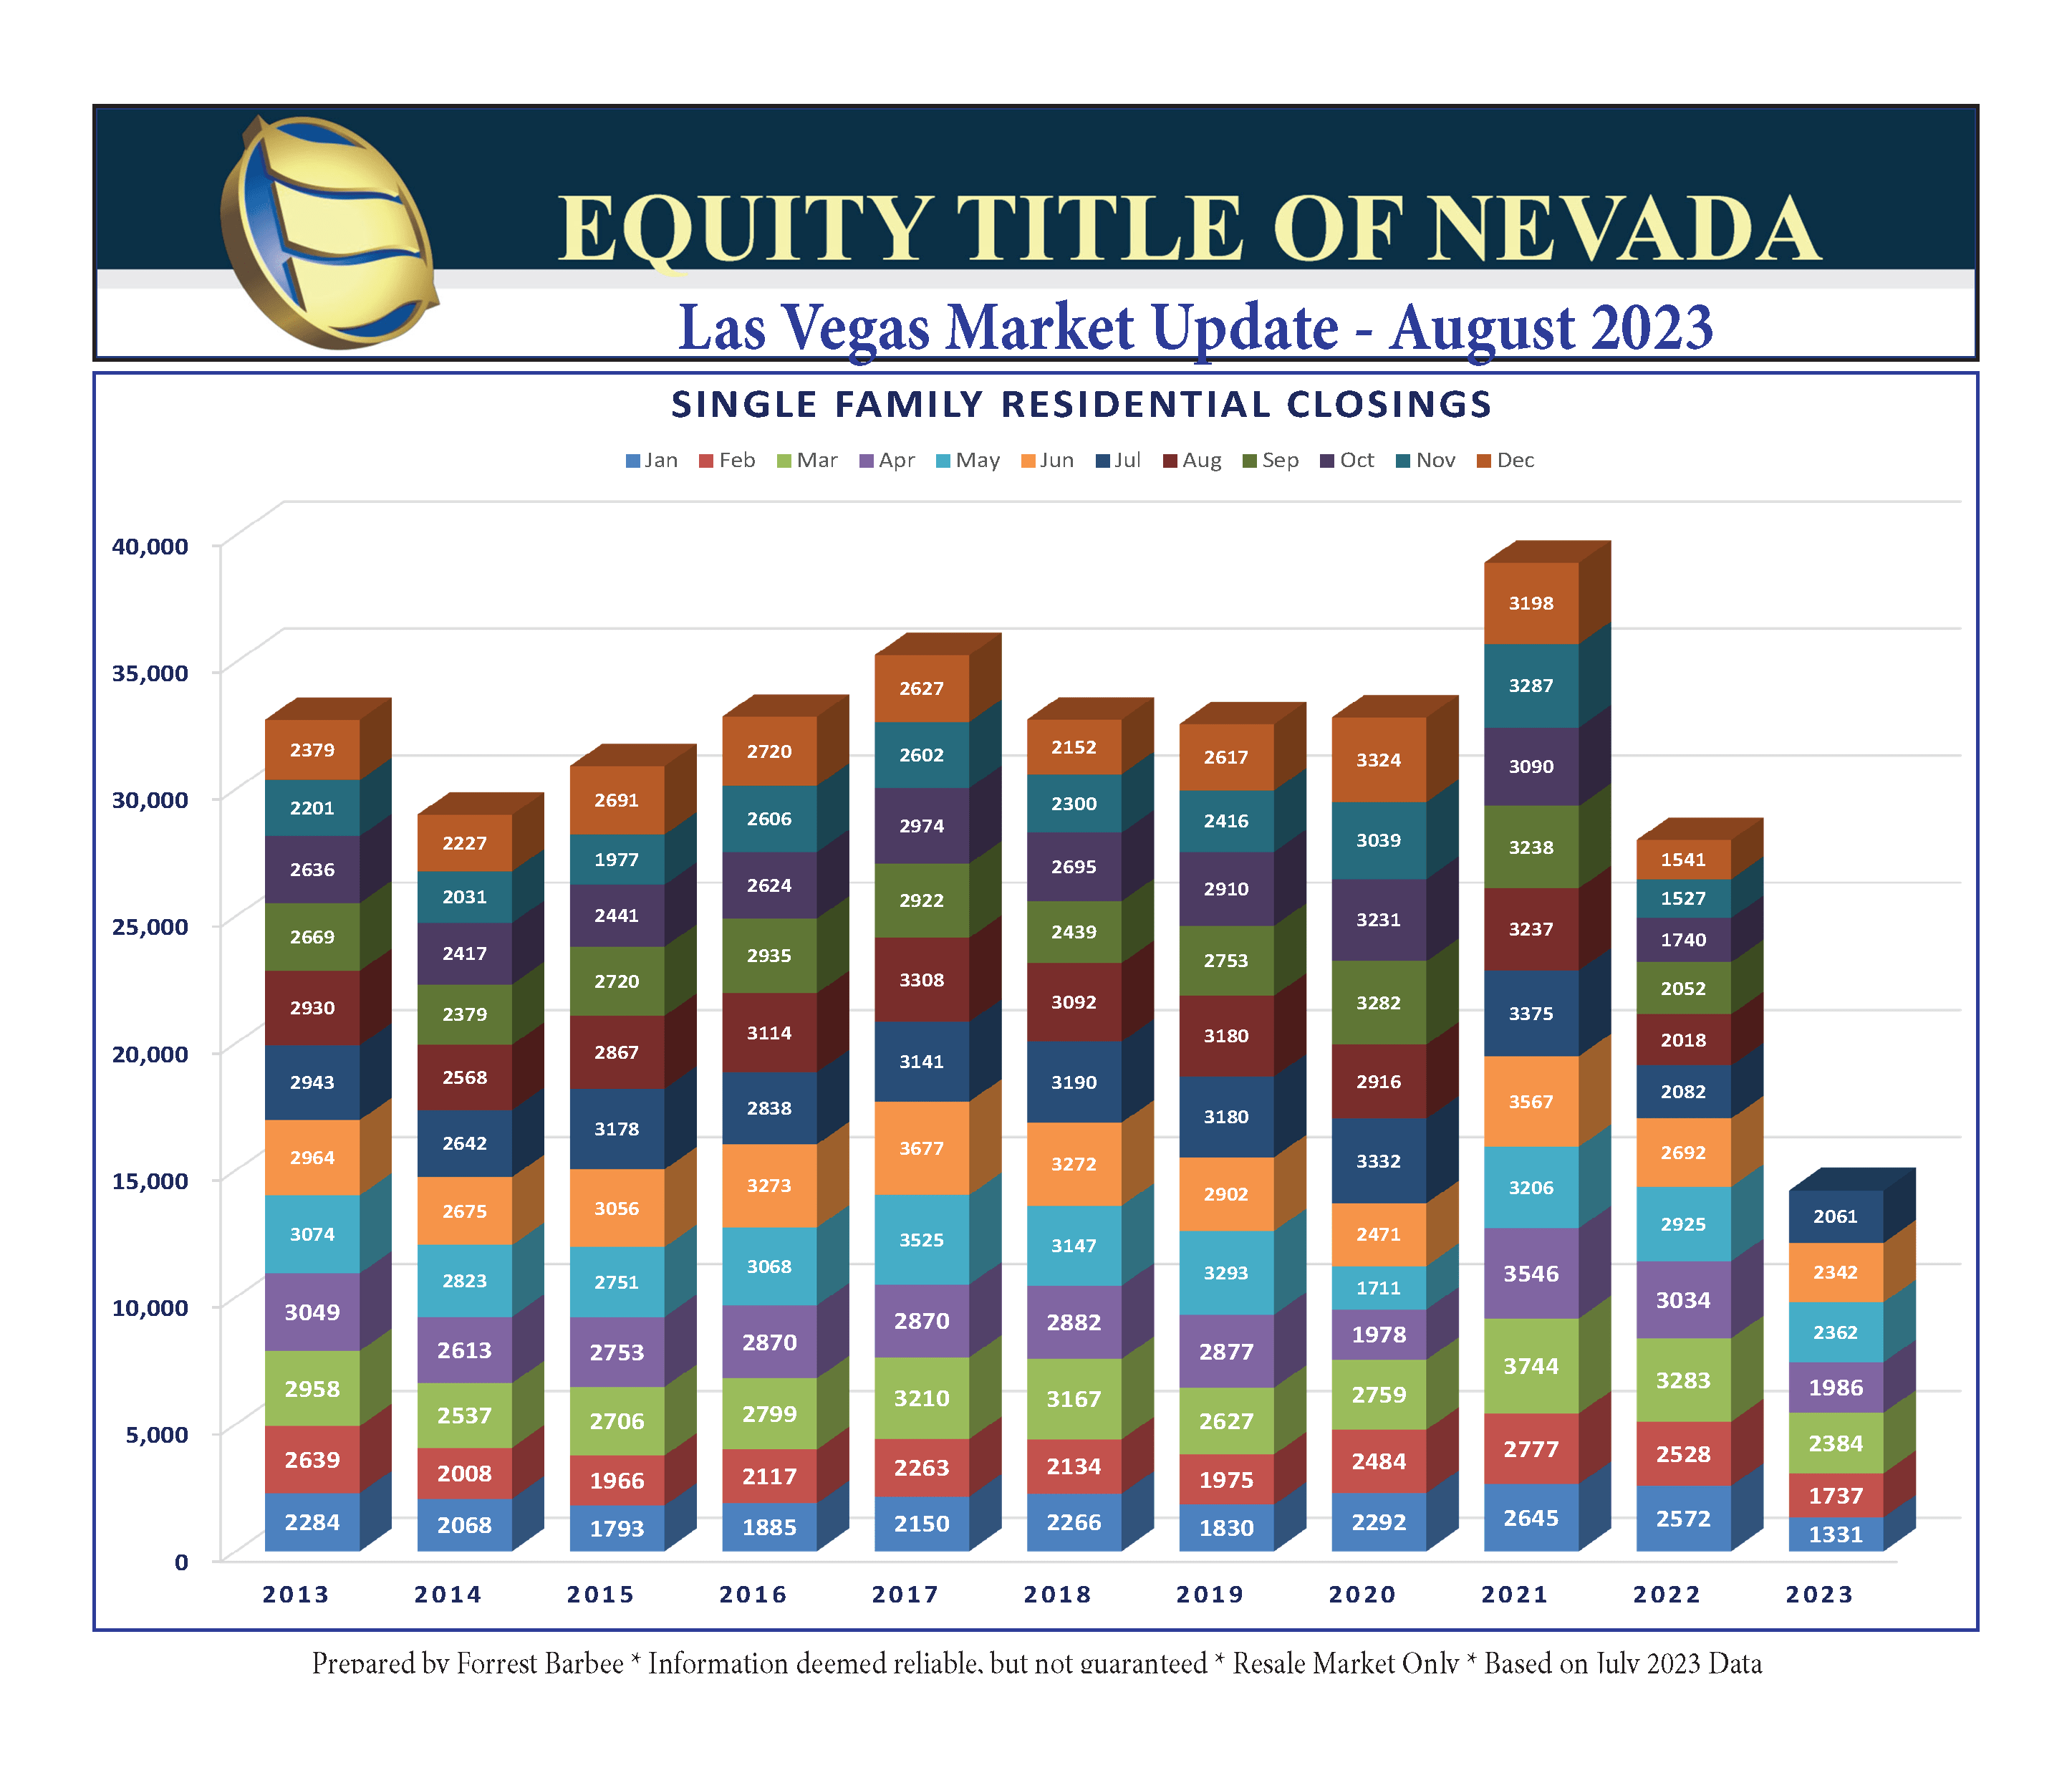
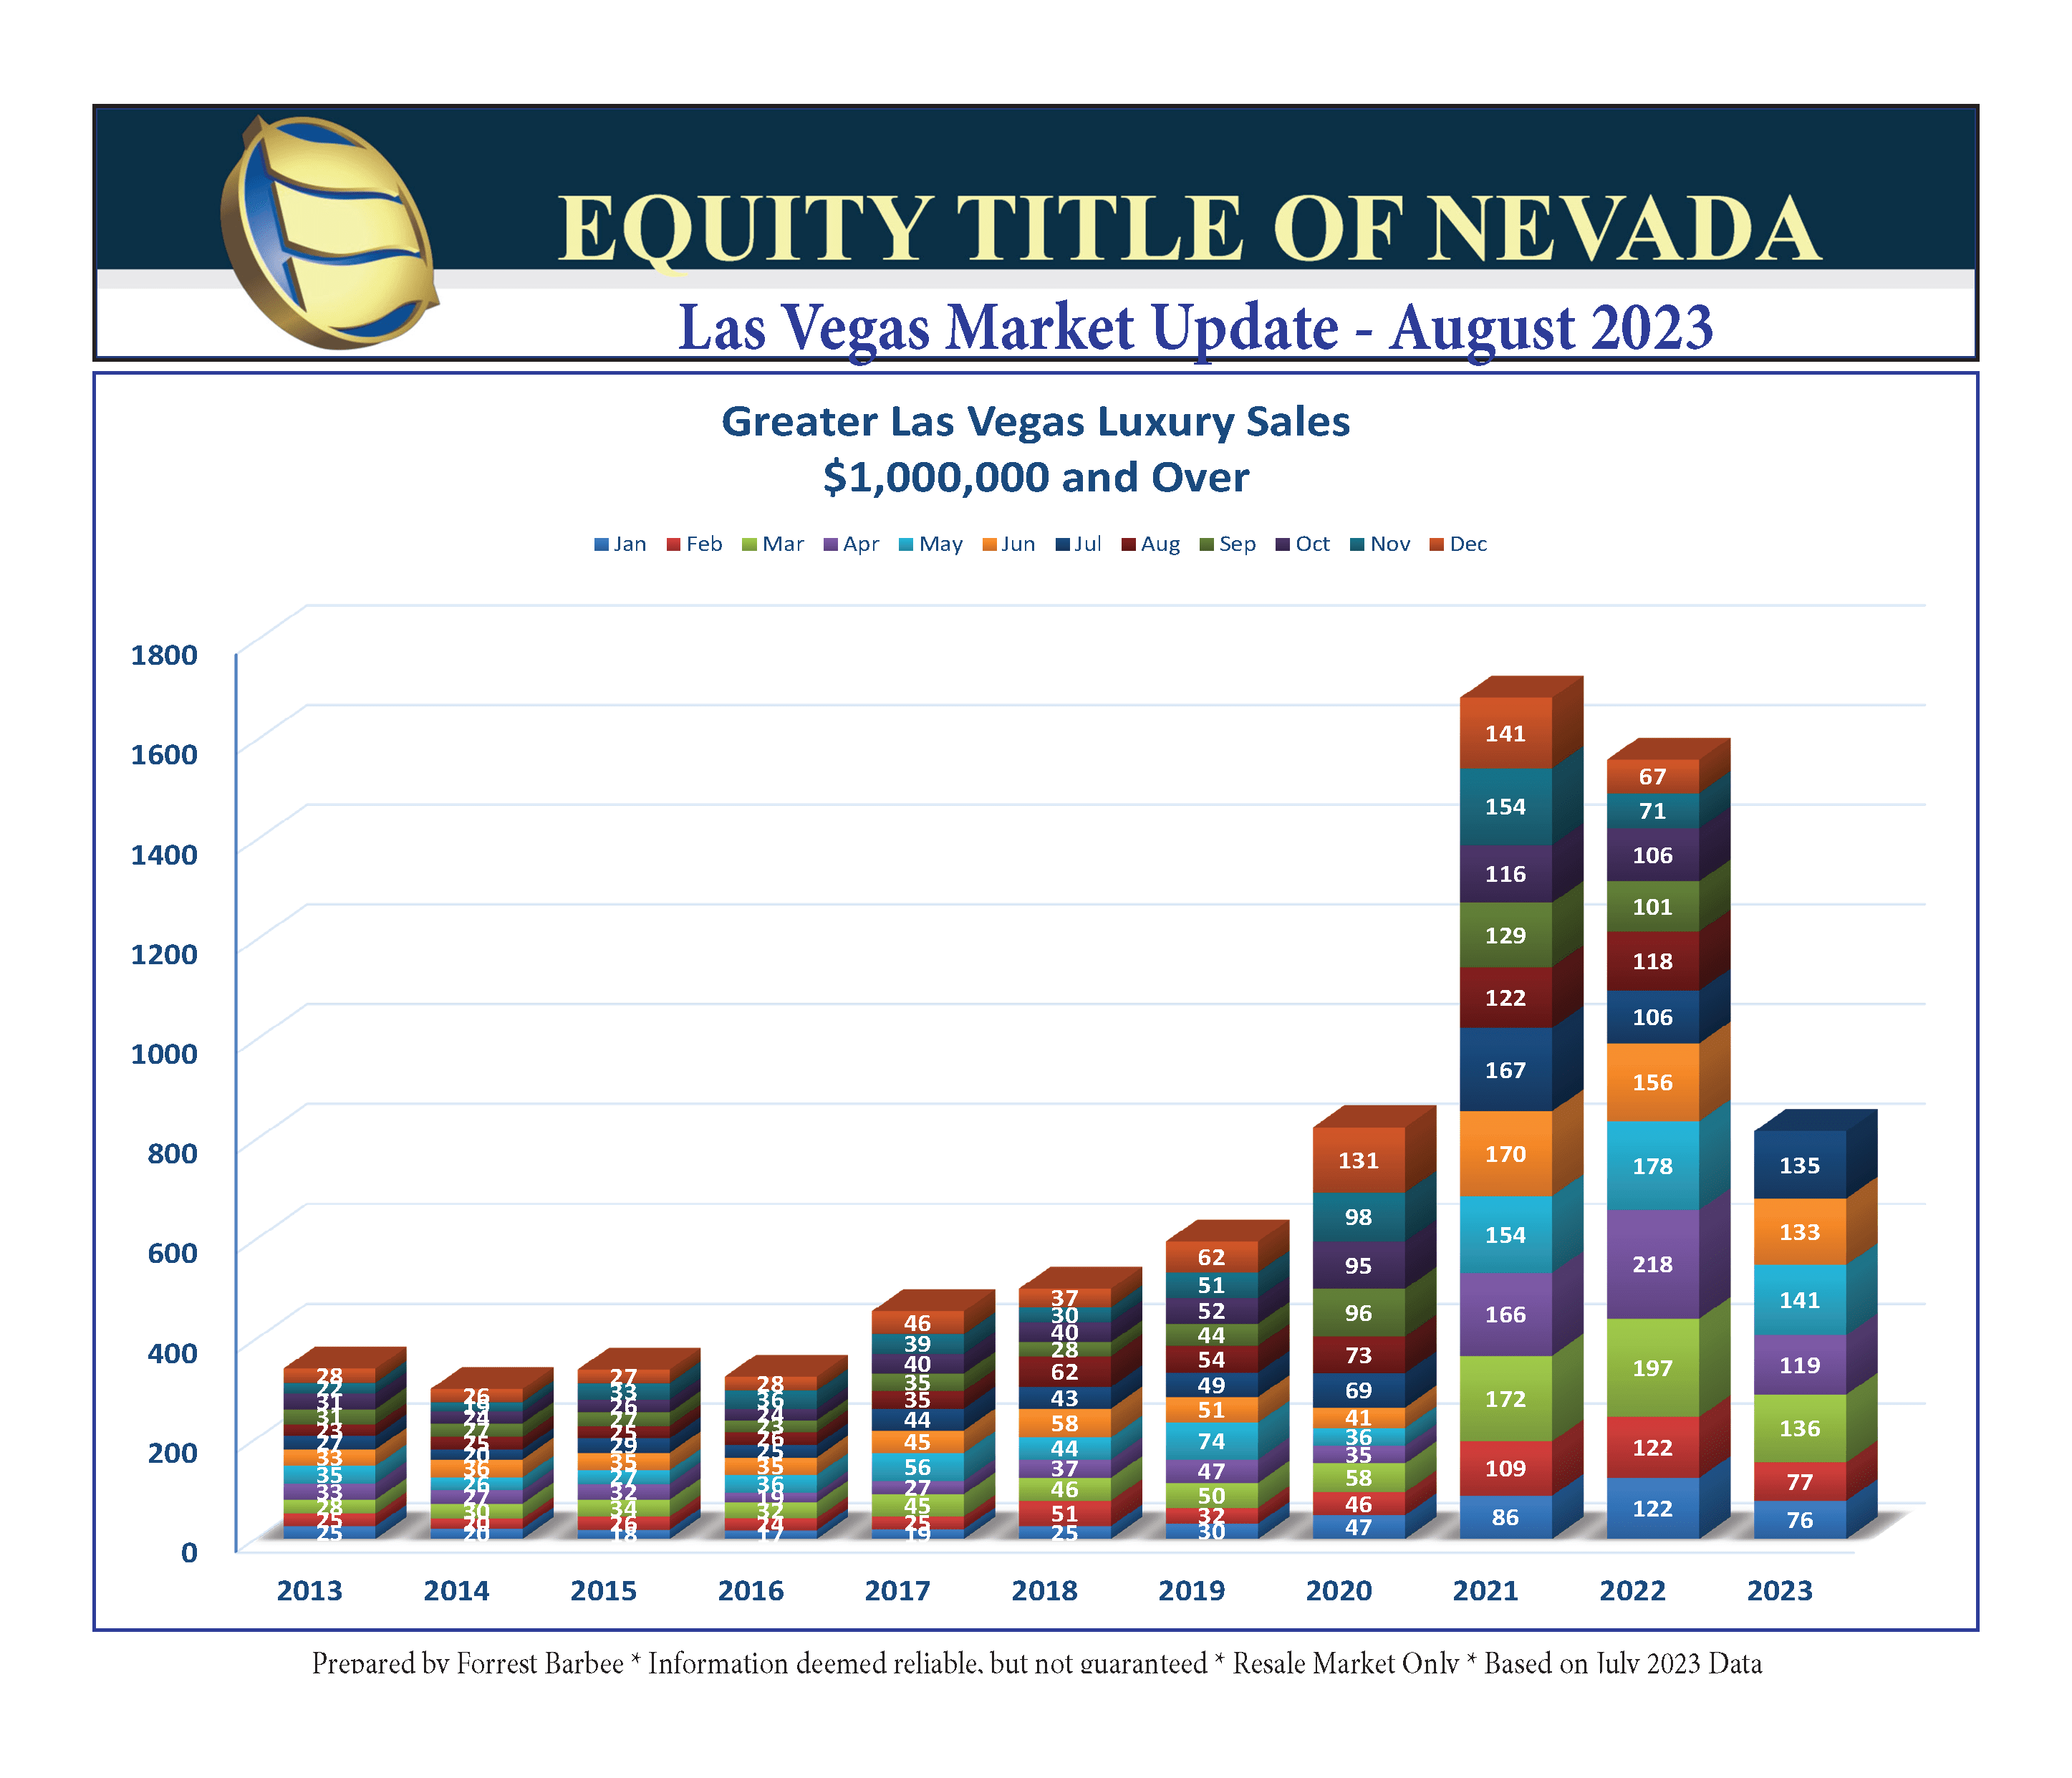
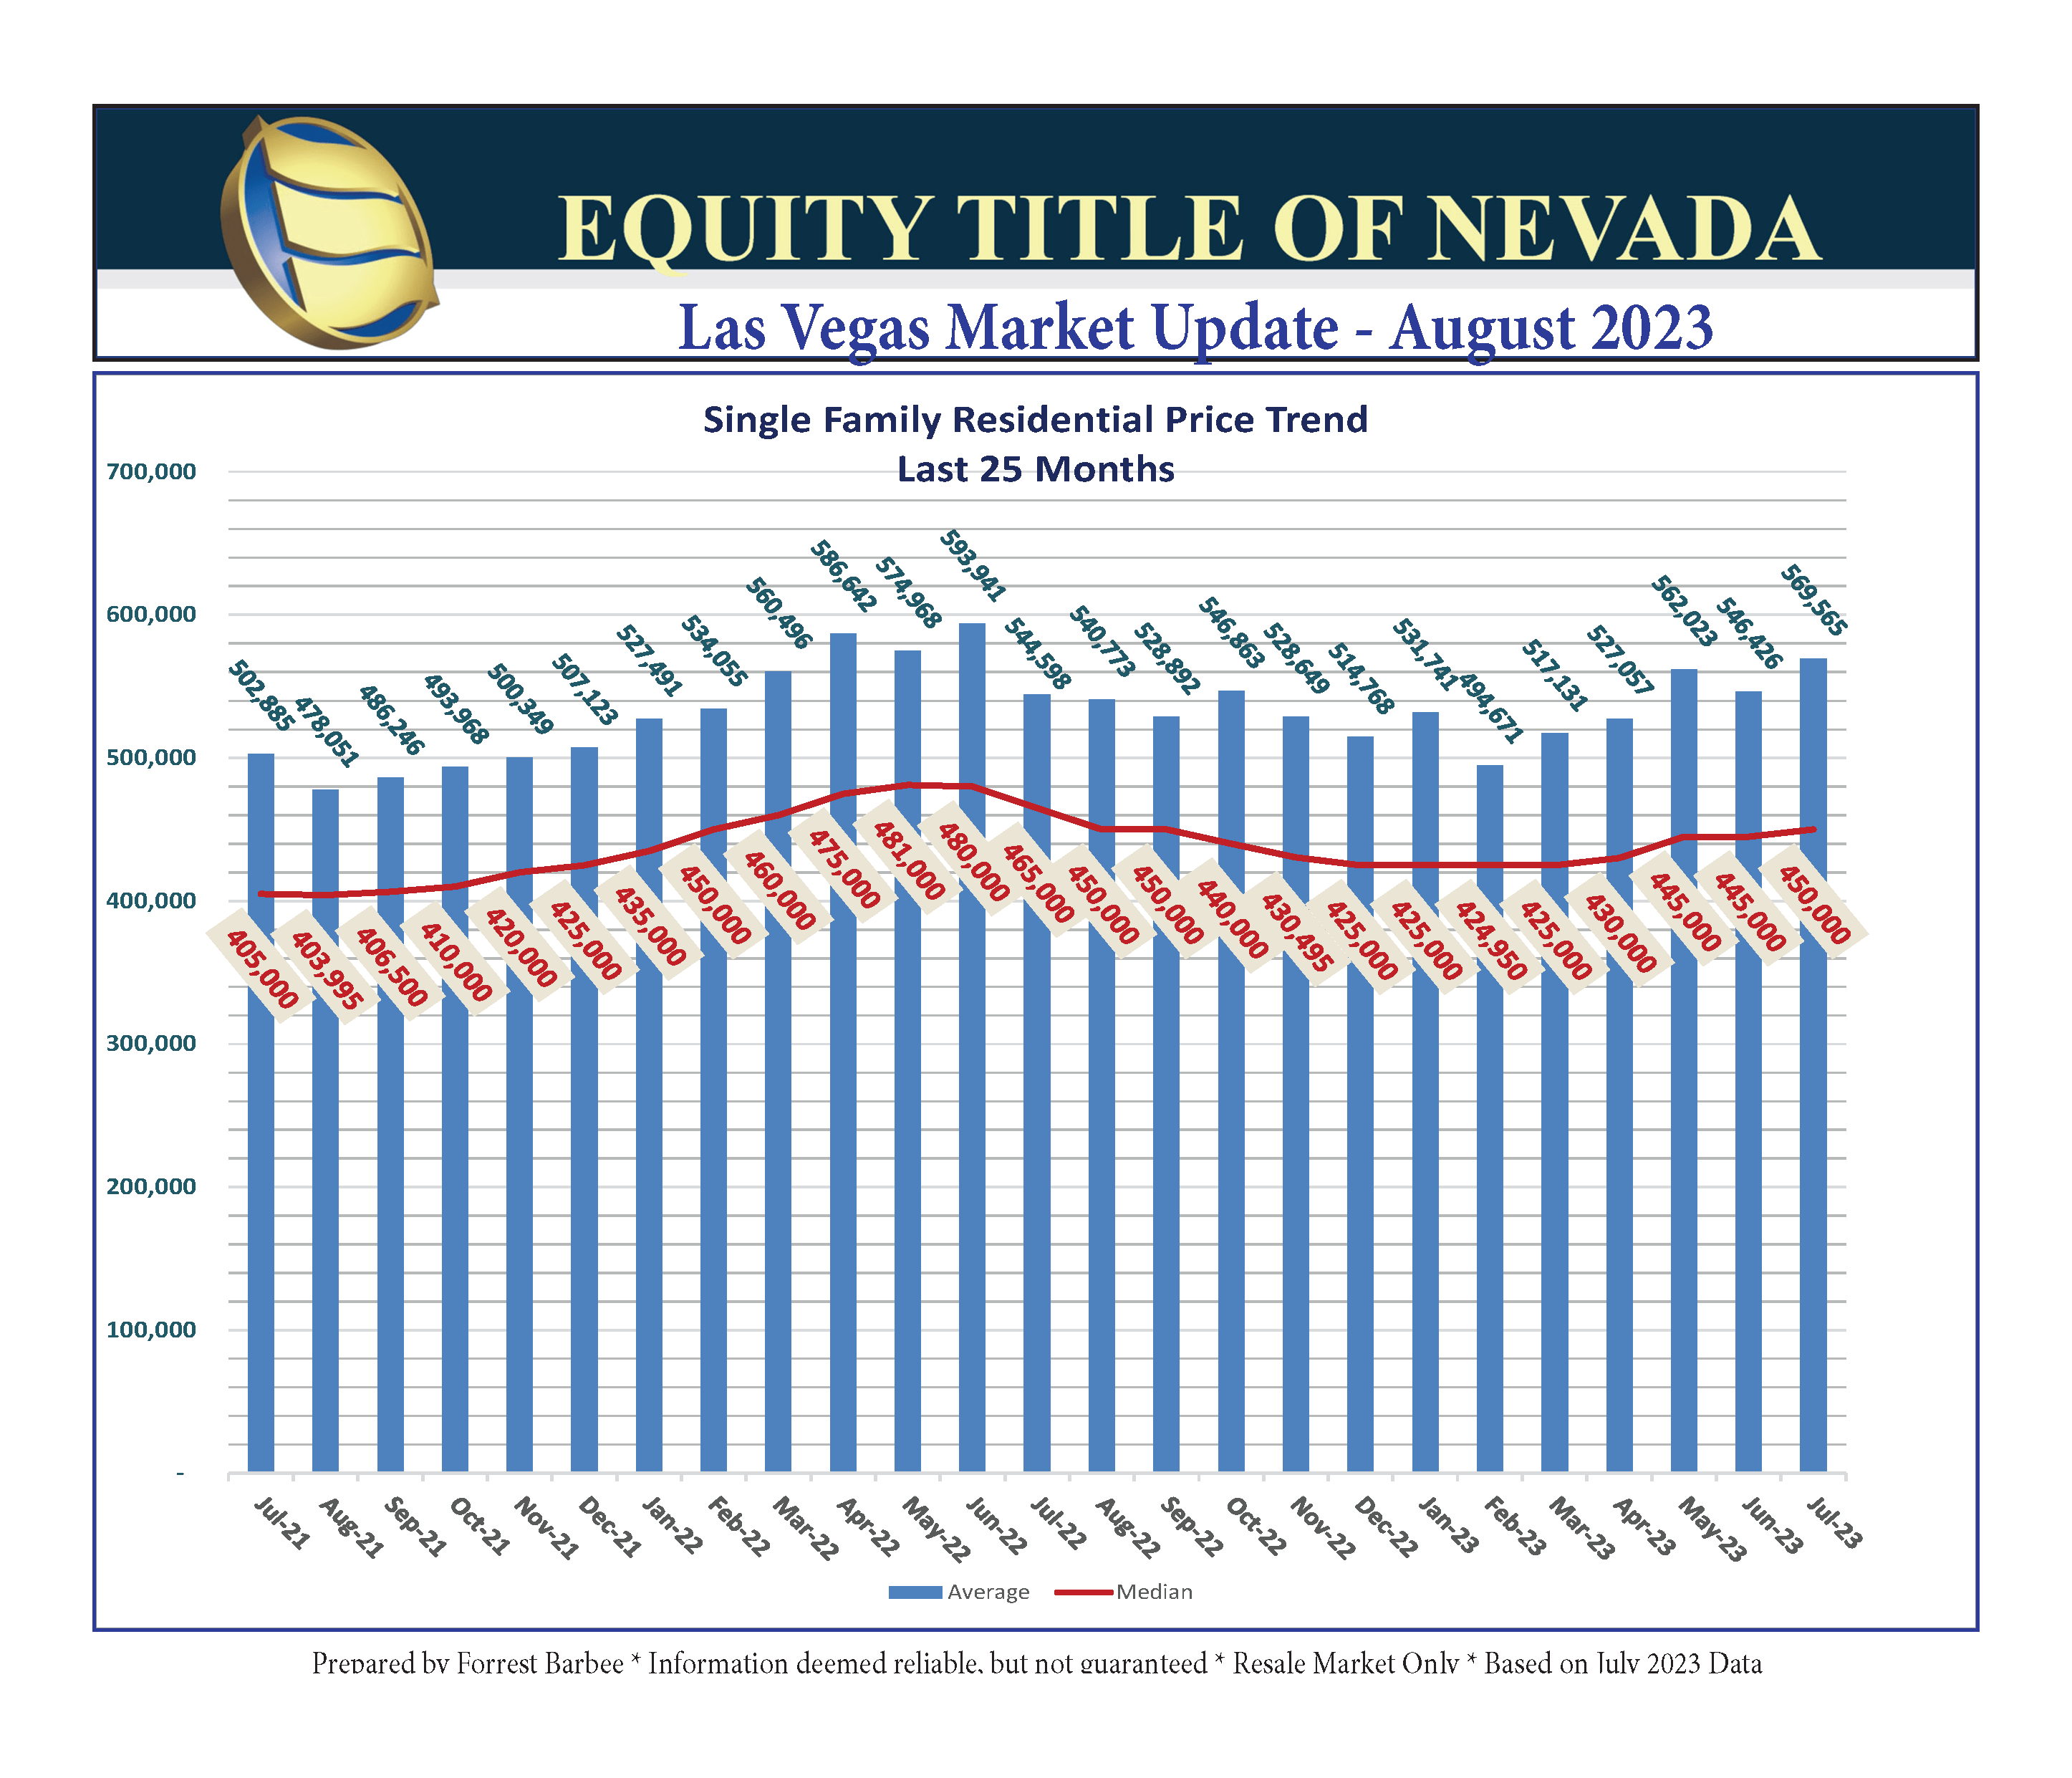
July results reflect more seasonality that in previous years, combined with high heat and overheated politics – including the Fed – again! So, what about the myth that prices are dropping? It’s not happening! Just review the “Last 25 Months” chart below and we can see that the trend is back up again even though closed units dipped in July. Consequently, the median price improved to $450,000 even as the average closed sales price of an SFR jumped to $569,565. The higher price points benefitted from strong conventional financing while the lower price points failed to attract the same level of cash buyers as before. Take note that luxury market closed sales units rose even though SFRs overall closed units dropped from last month.
Months of Inventory!
The real estate market is holding at 2.5 to 3 months of inventory, but that is the overall market and doesn’t address what’s going on in each community or subdivision. I make this point because too many agents prepare seller CMAs exactly the same way they prepare buyer CMAs. I take exception to that practice. Why? Because it’s my opinion that the goal of the buyer CMA is to determine value while second guessing the appraiser. We certainly don’t want our buyer to make unrealistic offers or be terribly surprised by the appraisal. However, I’m not looking for model matches when preparing a seller CMA. Why not? Because prospective buyers are not necessarily confining their search to my seller’s model.
More importantly, a seller CMA should clearly assist the seller with an understanding of the supply versus demand dynamic in his/her community or neighborhood. Simply, an over-supply may mean that the seller may not expect to obtain full market value if they have time constraints for selling. Conversely, we have already witnessed sellers closing on homes above market value when demand is high and supply is low.