Las Vegas Market Overview
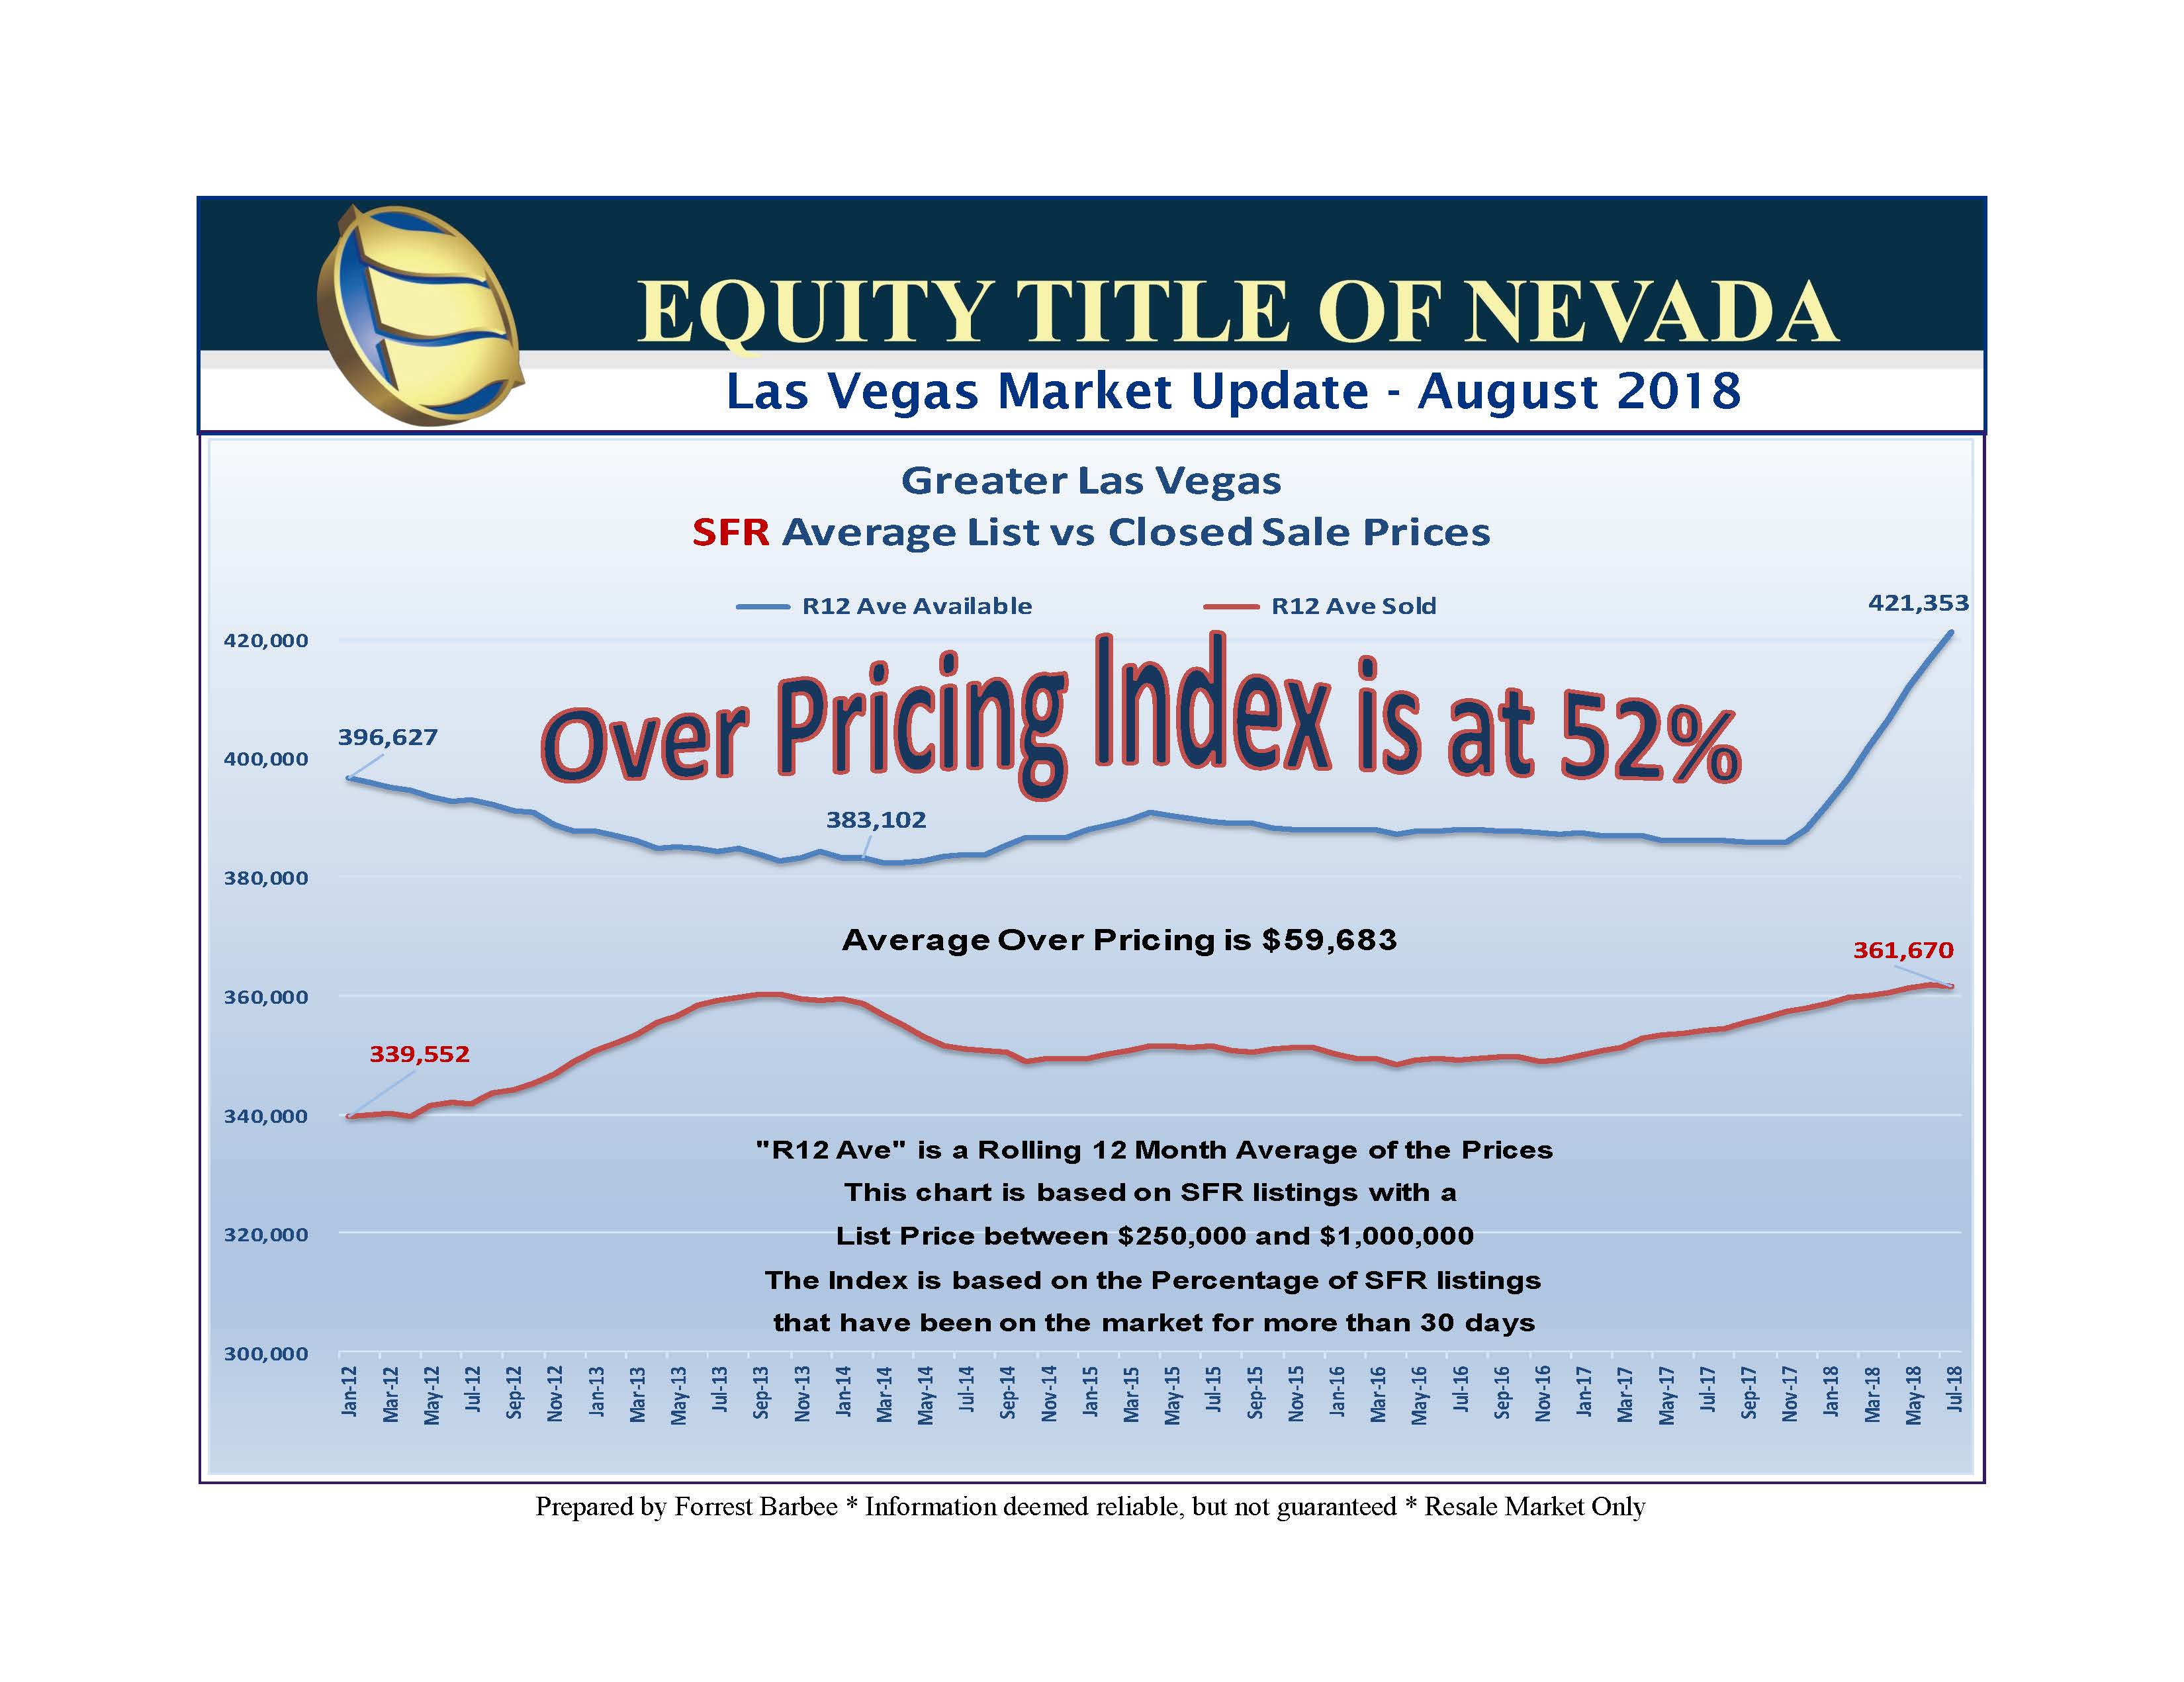
July 2018 Single Family Residential (SFR) closed sales were down 2.7% from June 2018 and were basically flat compared to the same period last year. The SFR median sales price held at $290,000 while the SFR average closing price dipped to $332,409 for a 1.6% decrease from last month. Residential inventory as well as months of inventory are both up somewhat with about 1.6 months of inventory. Yet, the amount and level of over pricings reduces the marketable (priced to sell) inventory at about 3 weeks!
Click Here for Individual Las Vegas Market Charts
Click Here for the Current Las Vegas Market Update Report
Closed Units & Price Appreciation
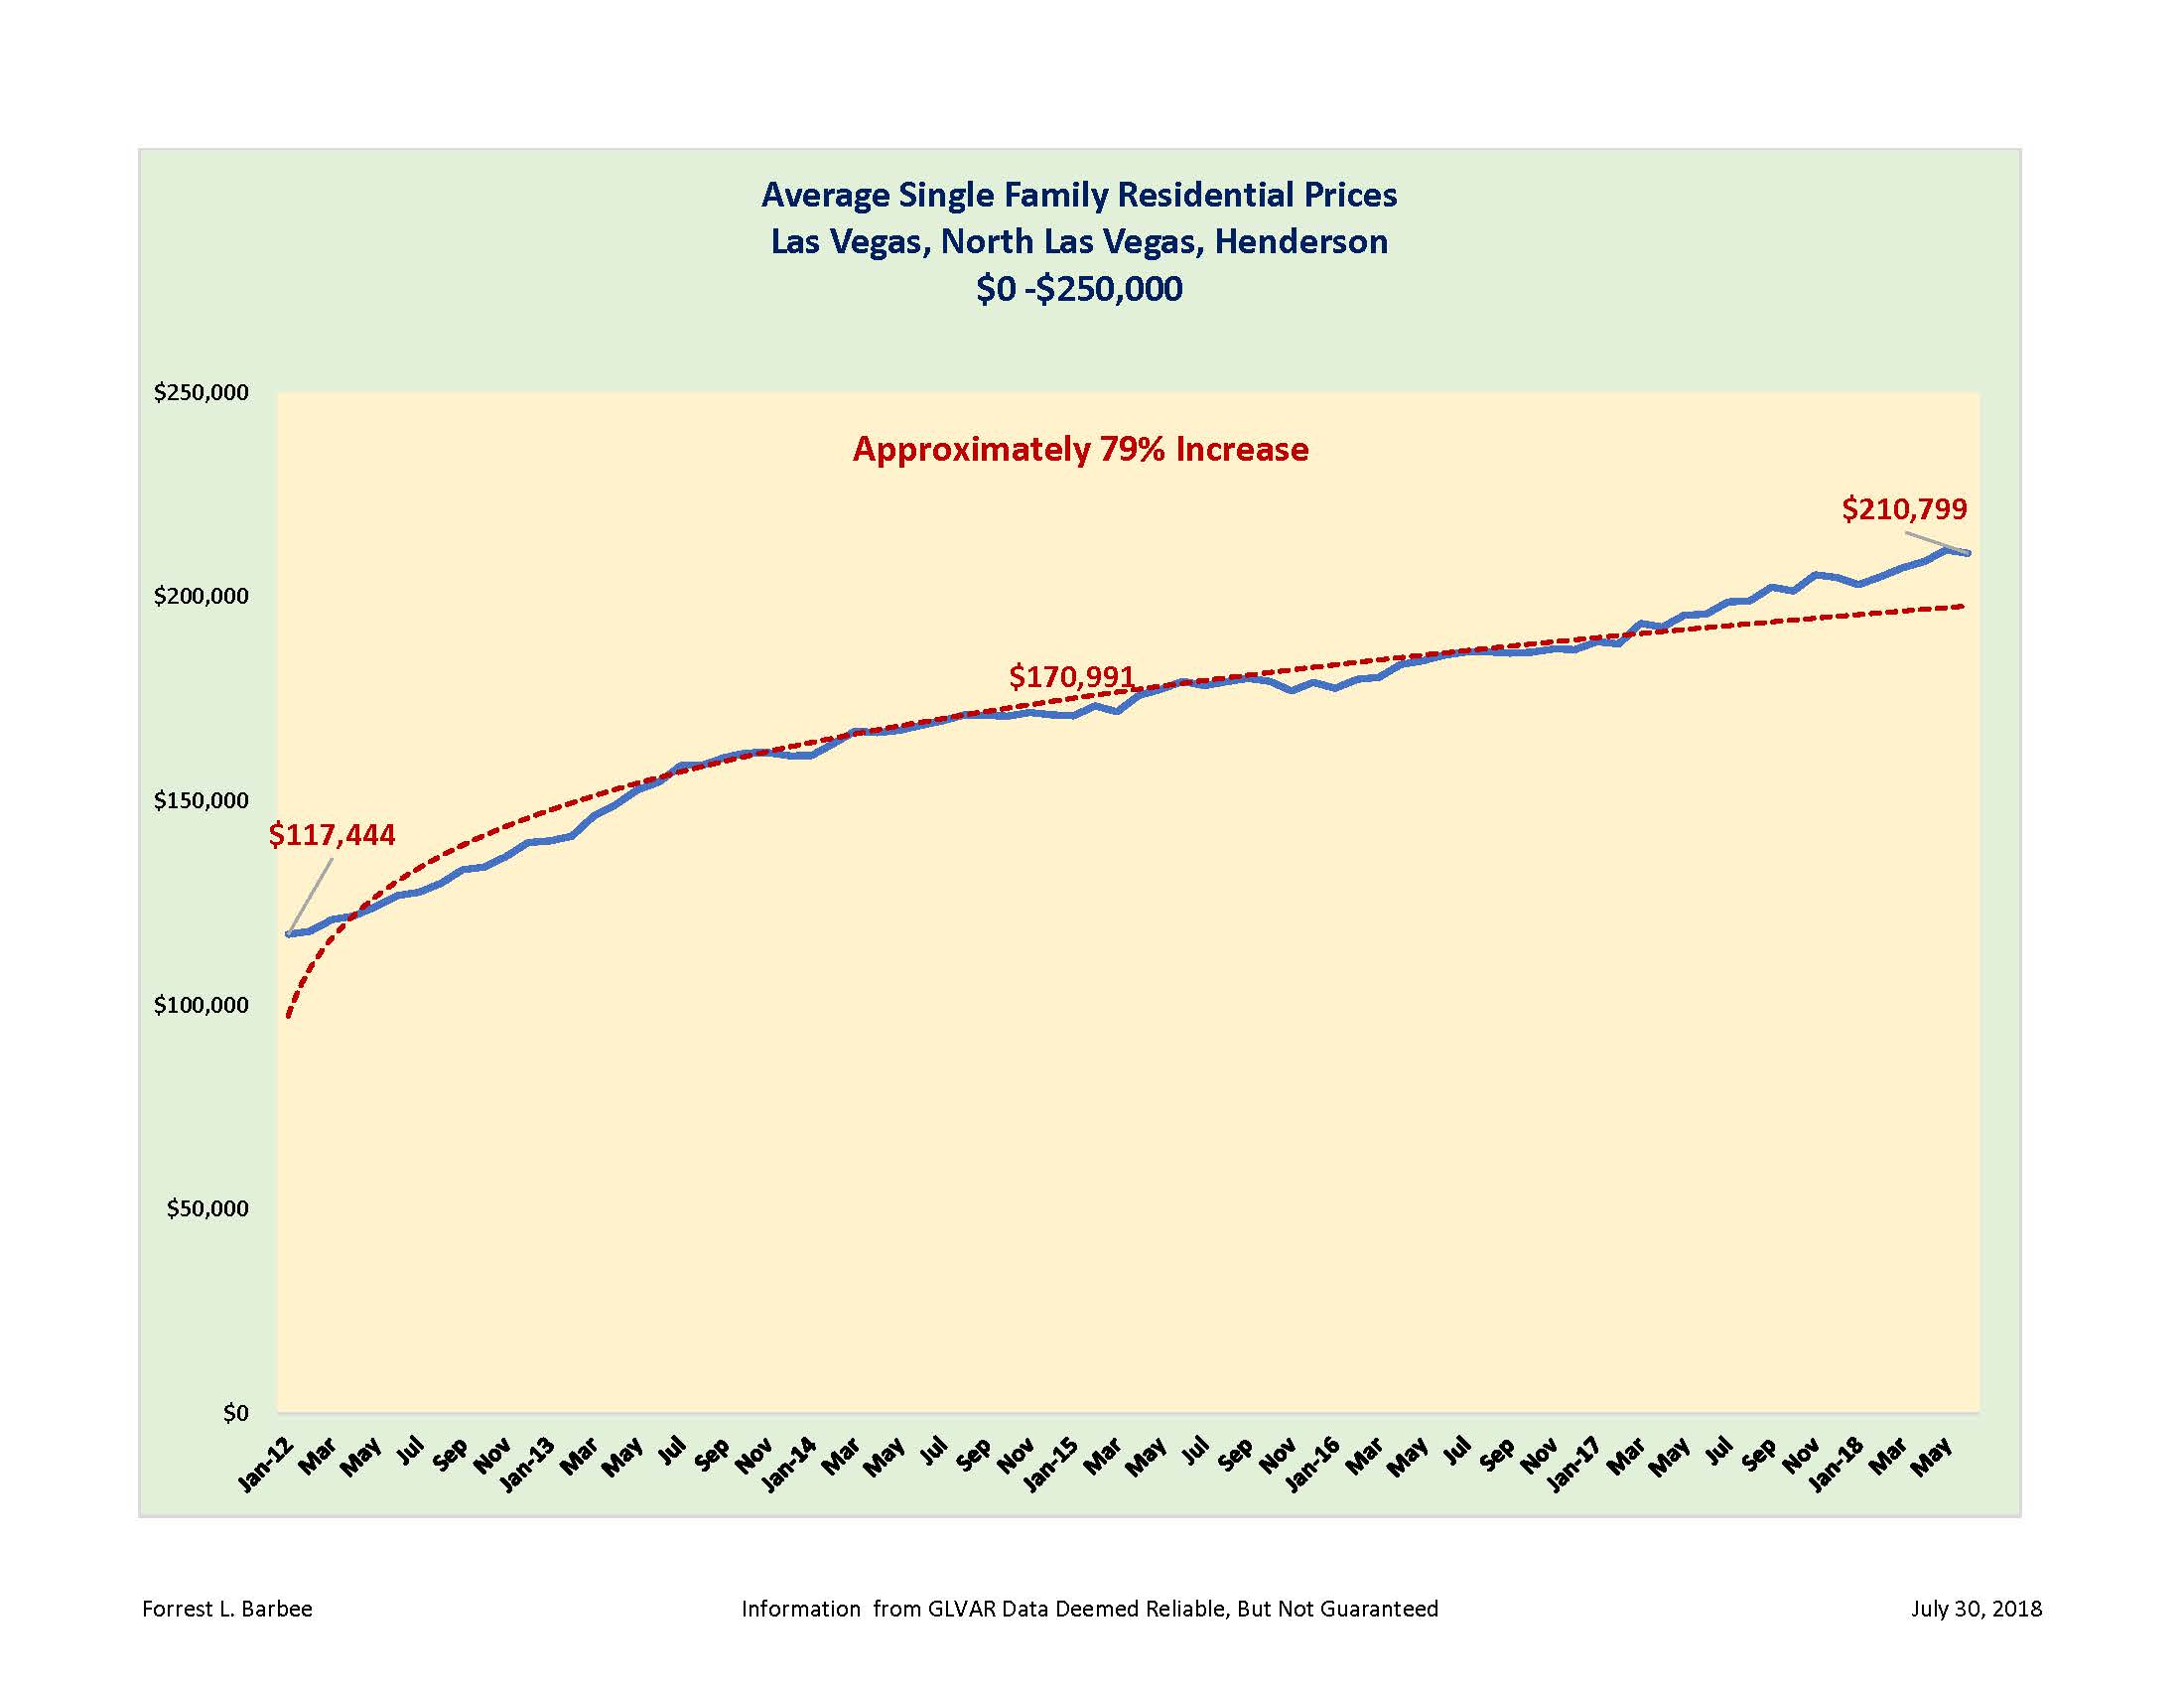
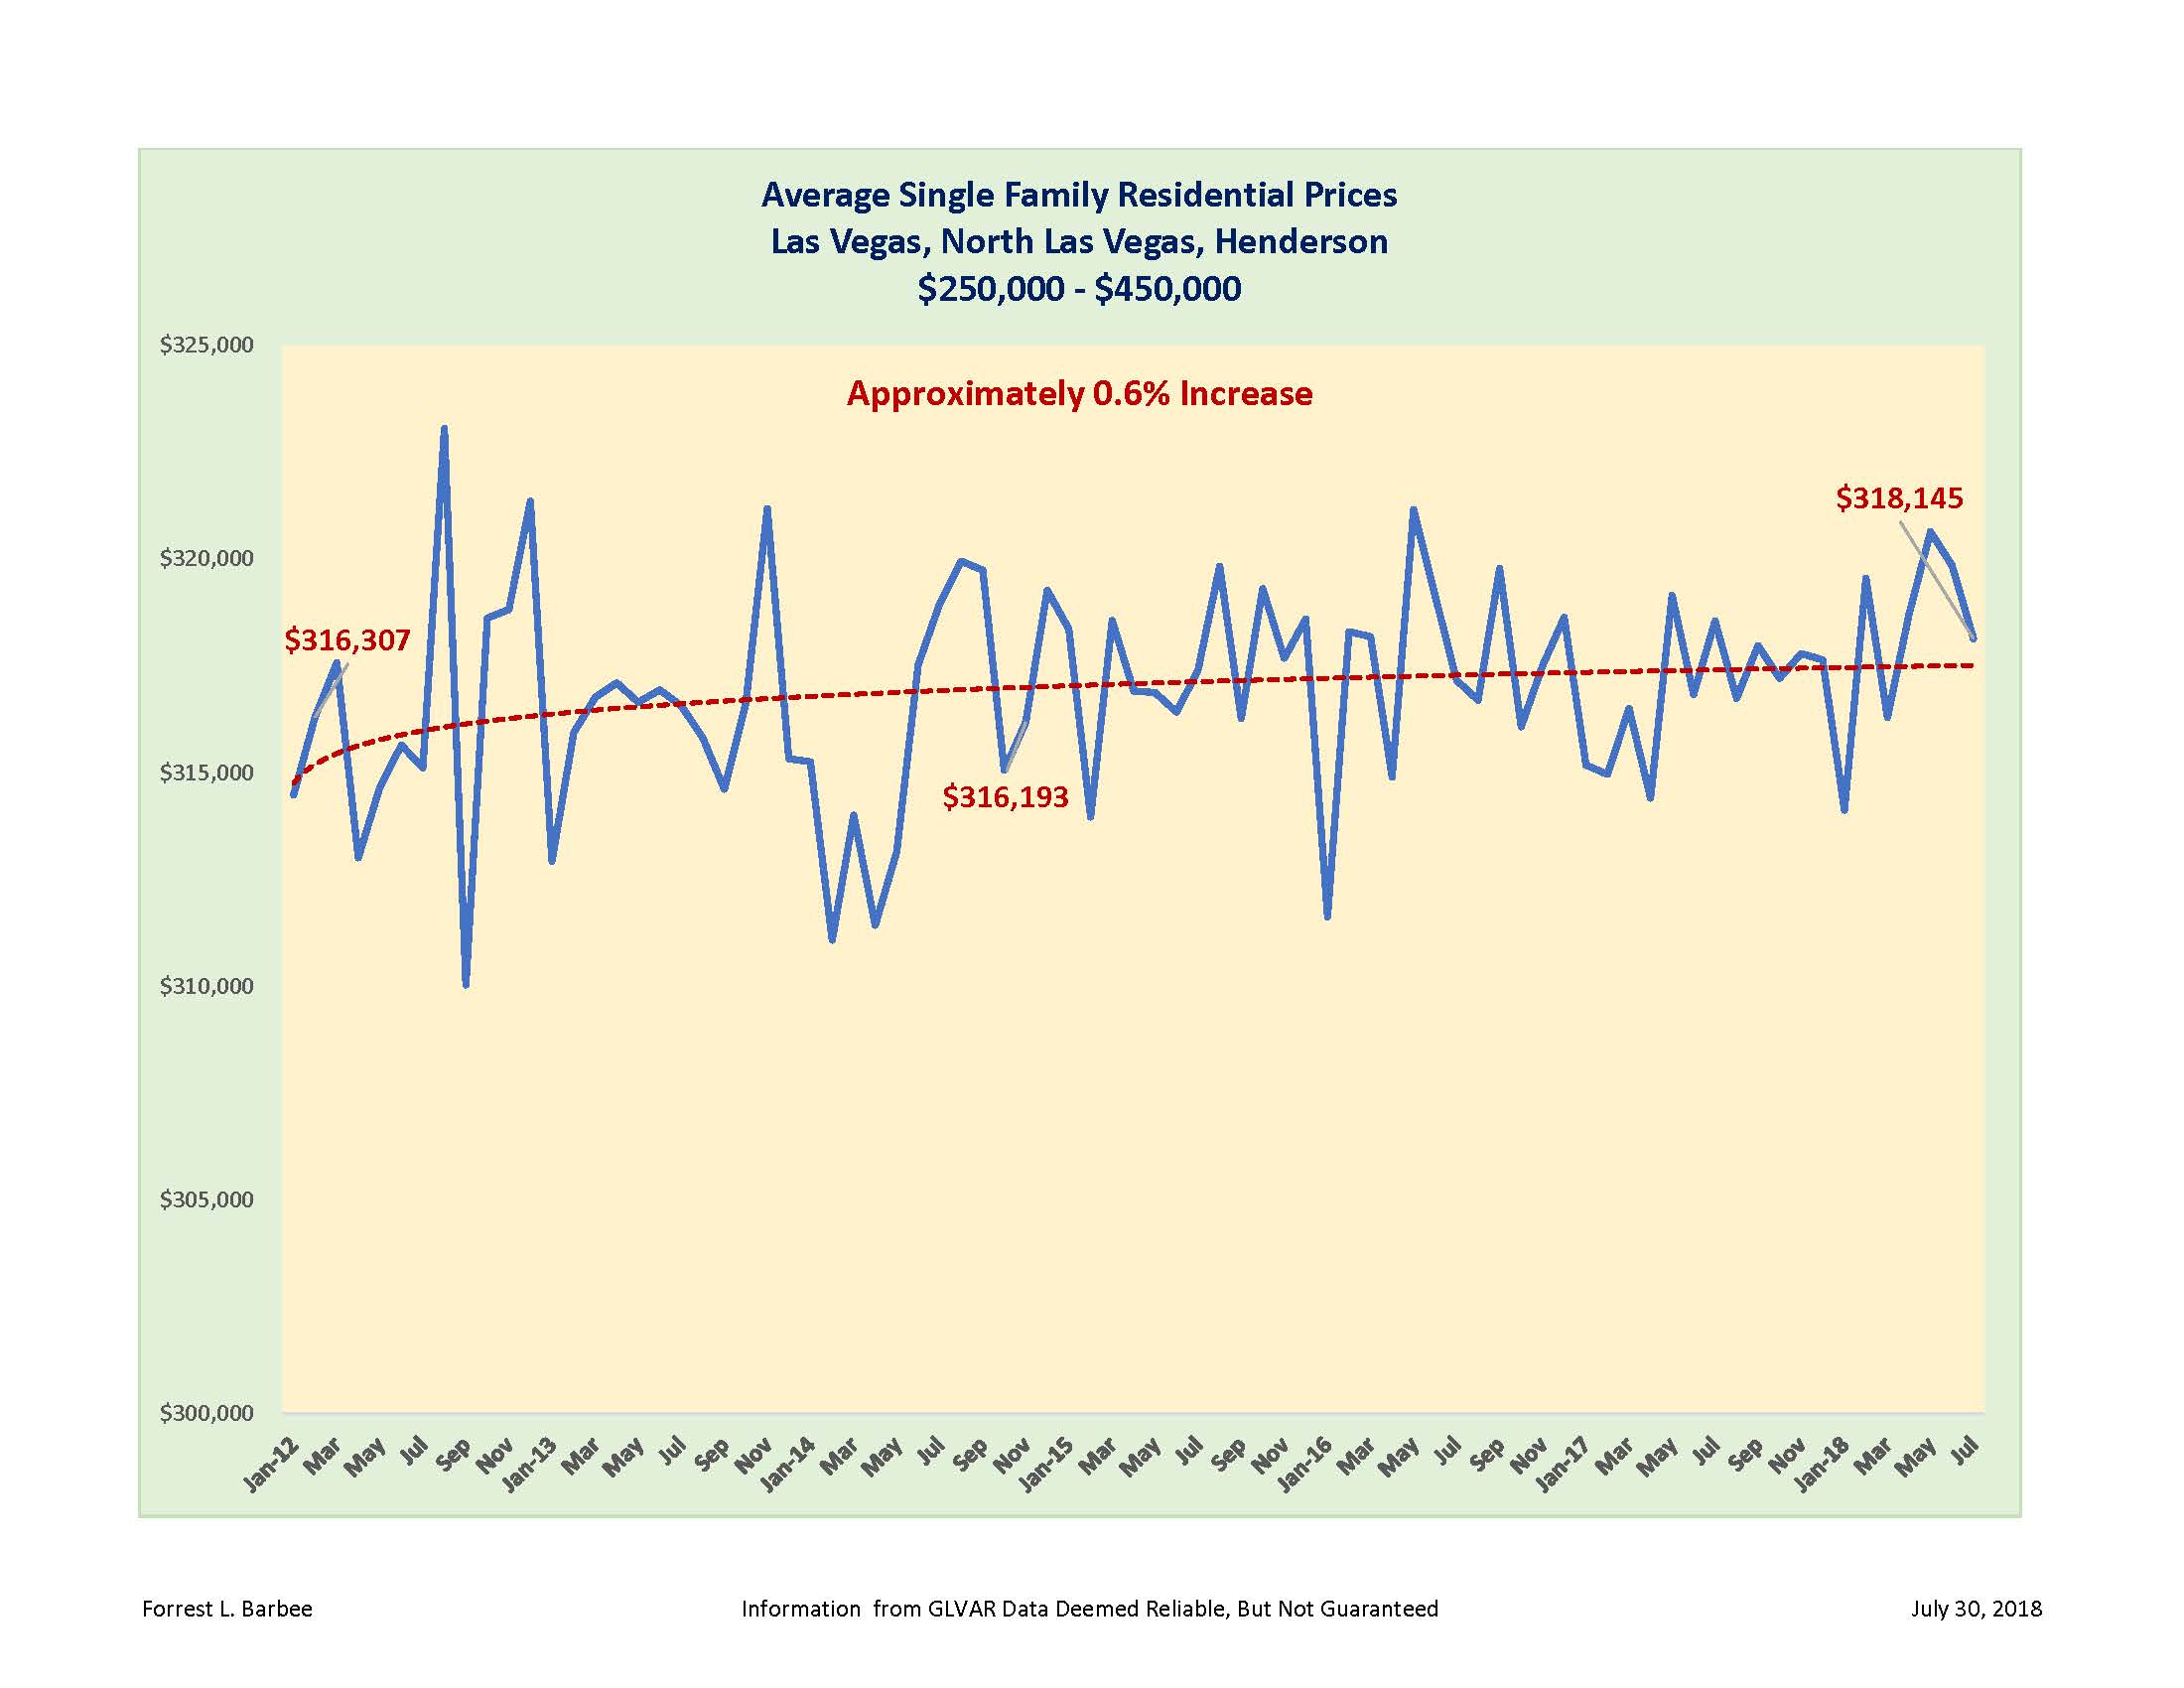
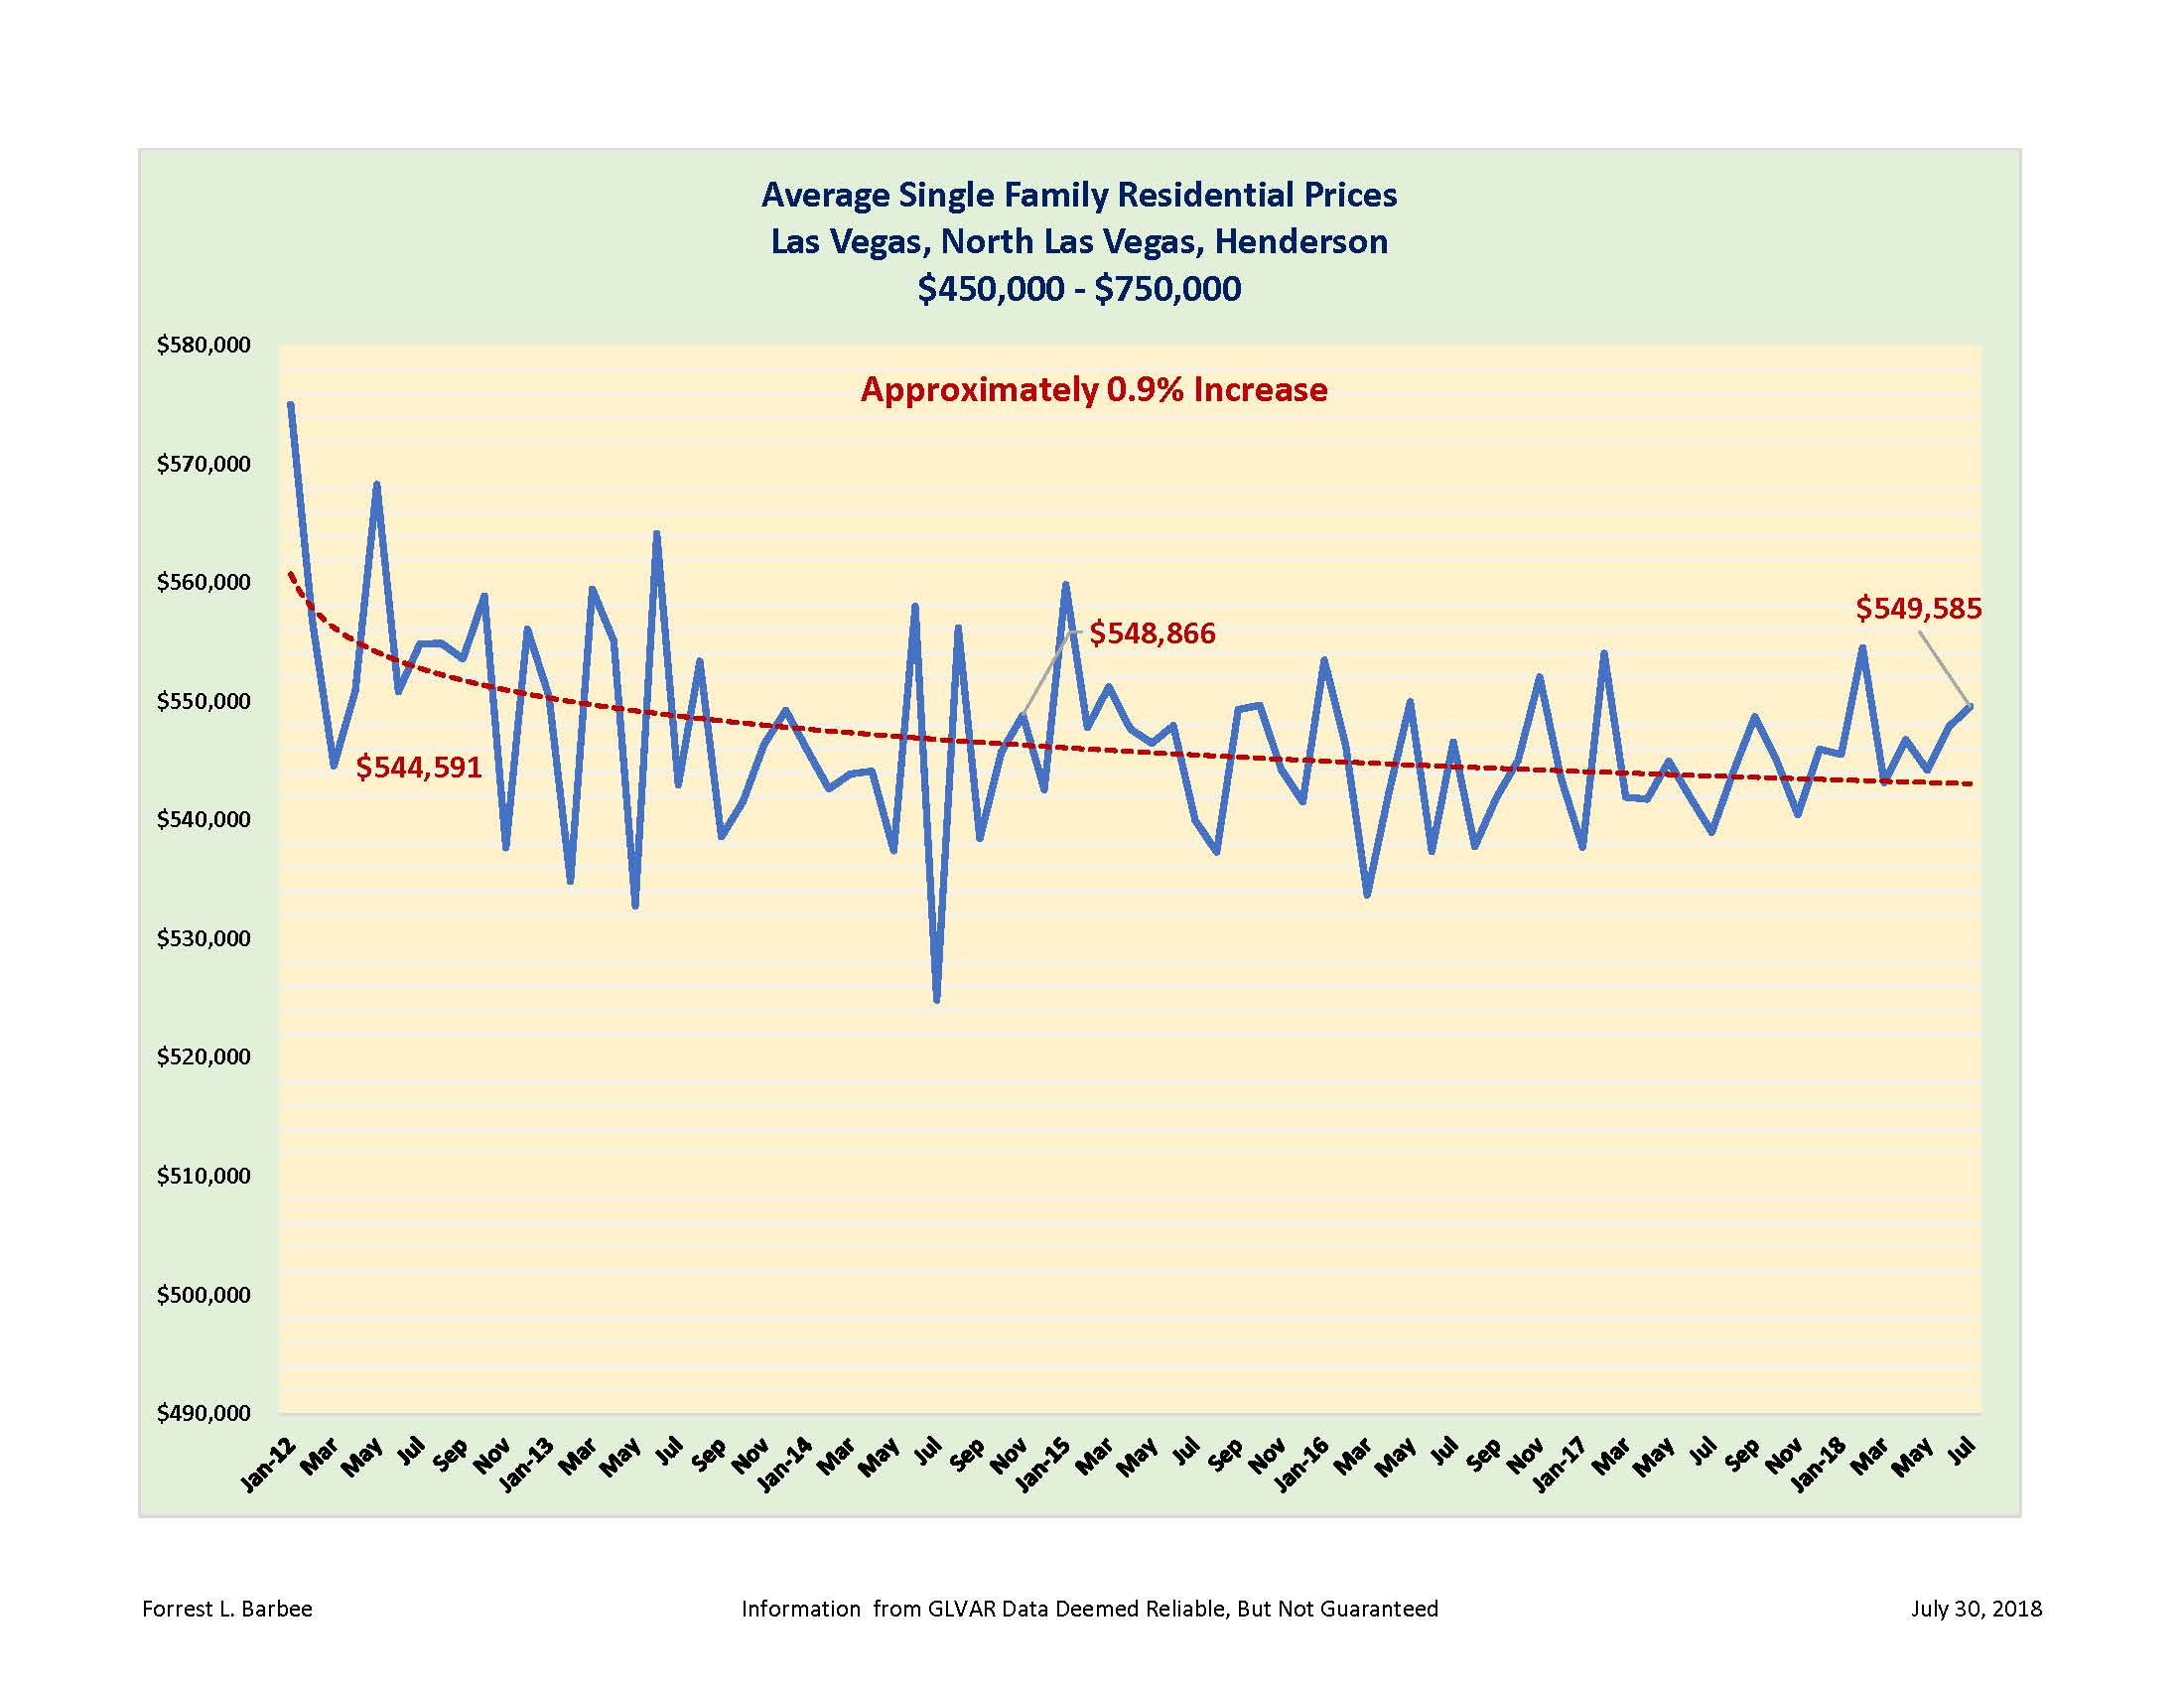
Residential units are down 2.4% compared to this point in 2017. It’s looking more like 2016 or 2005 despite an uptick in hi-rise sales and a robust luxury market. Oh – and about those reports of double digit market value increased in the “over heated” Las Vegas real estate market. Carefully note the charts below showing significant double digit market increases in properties below $250,000 while clearly underscoring the lack of six year plus cumulative appreciation at other price points!
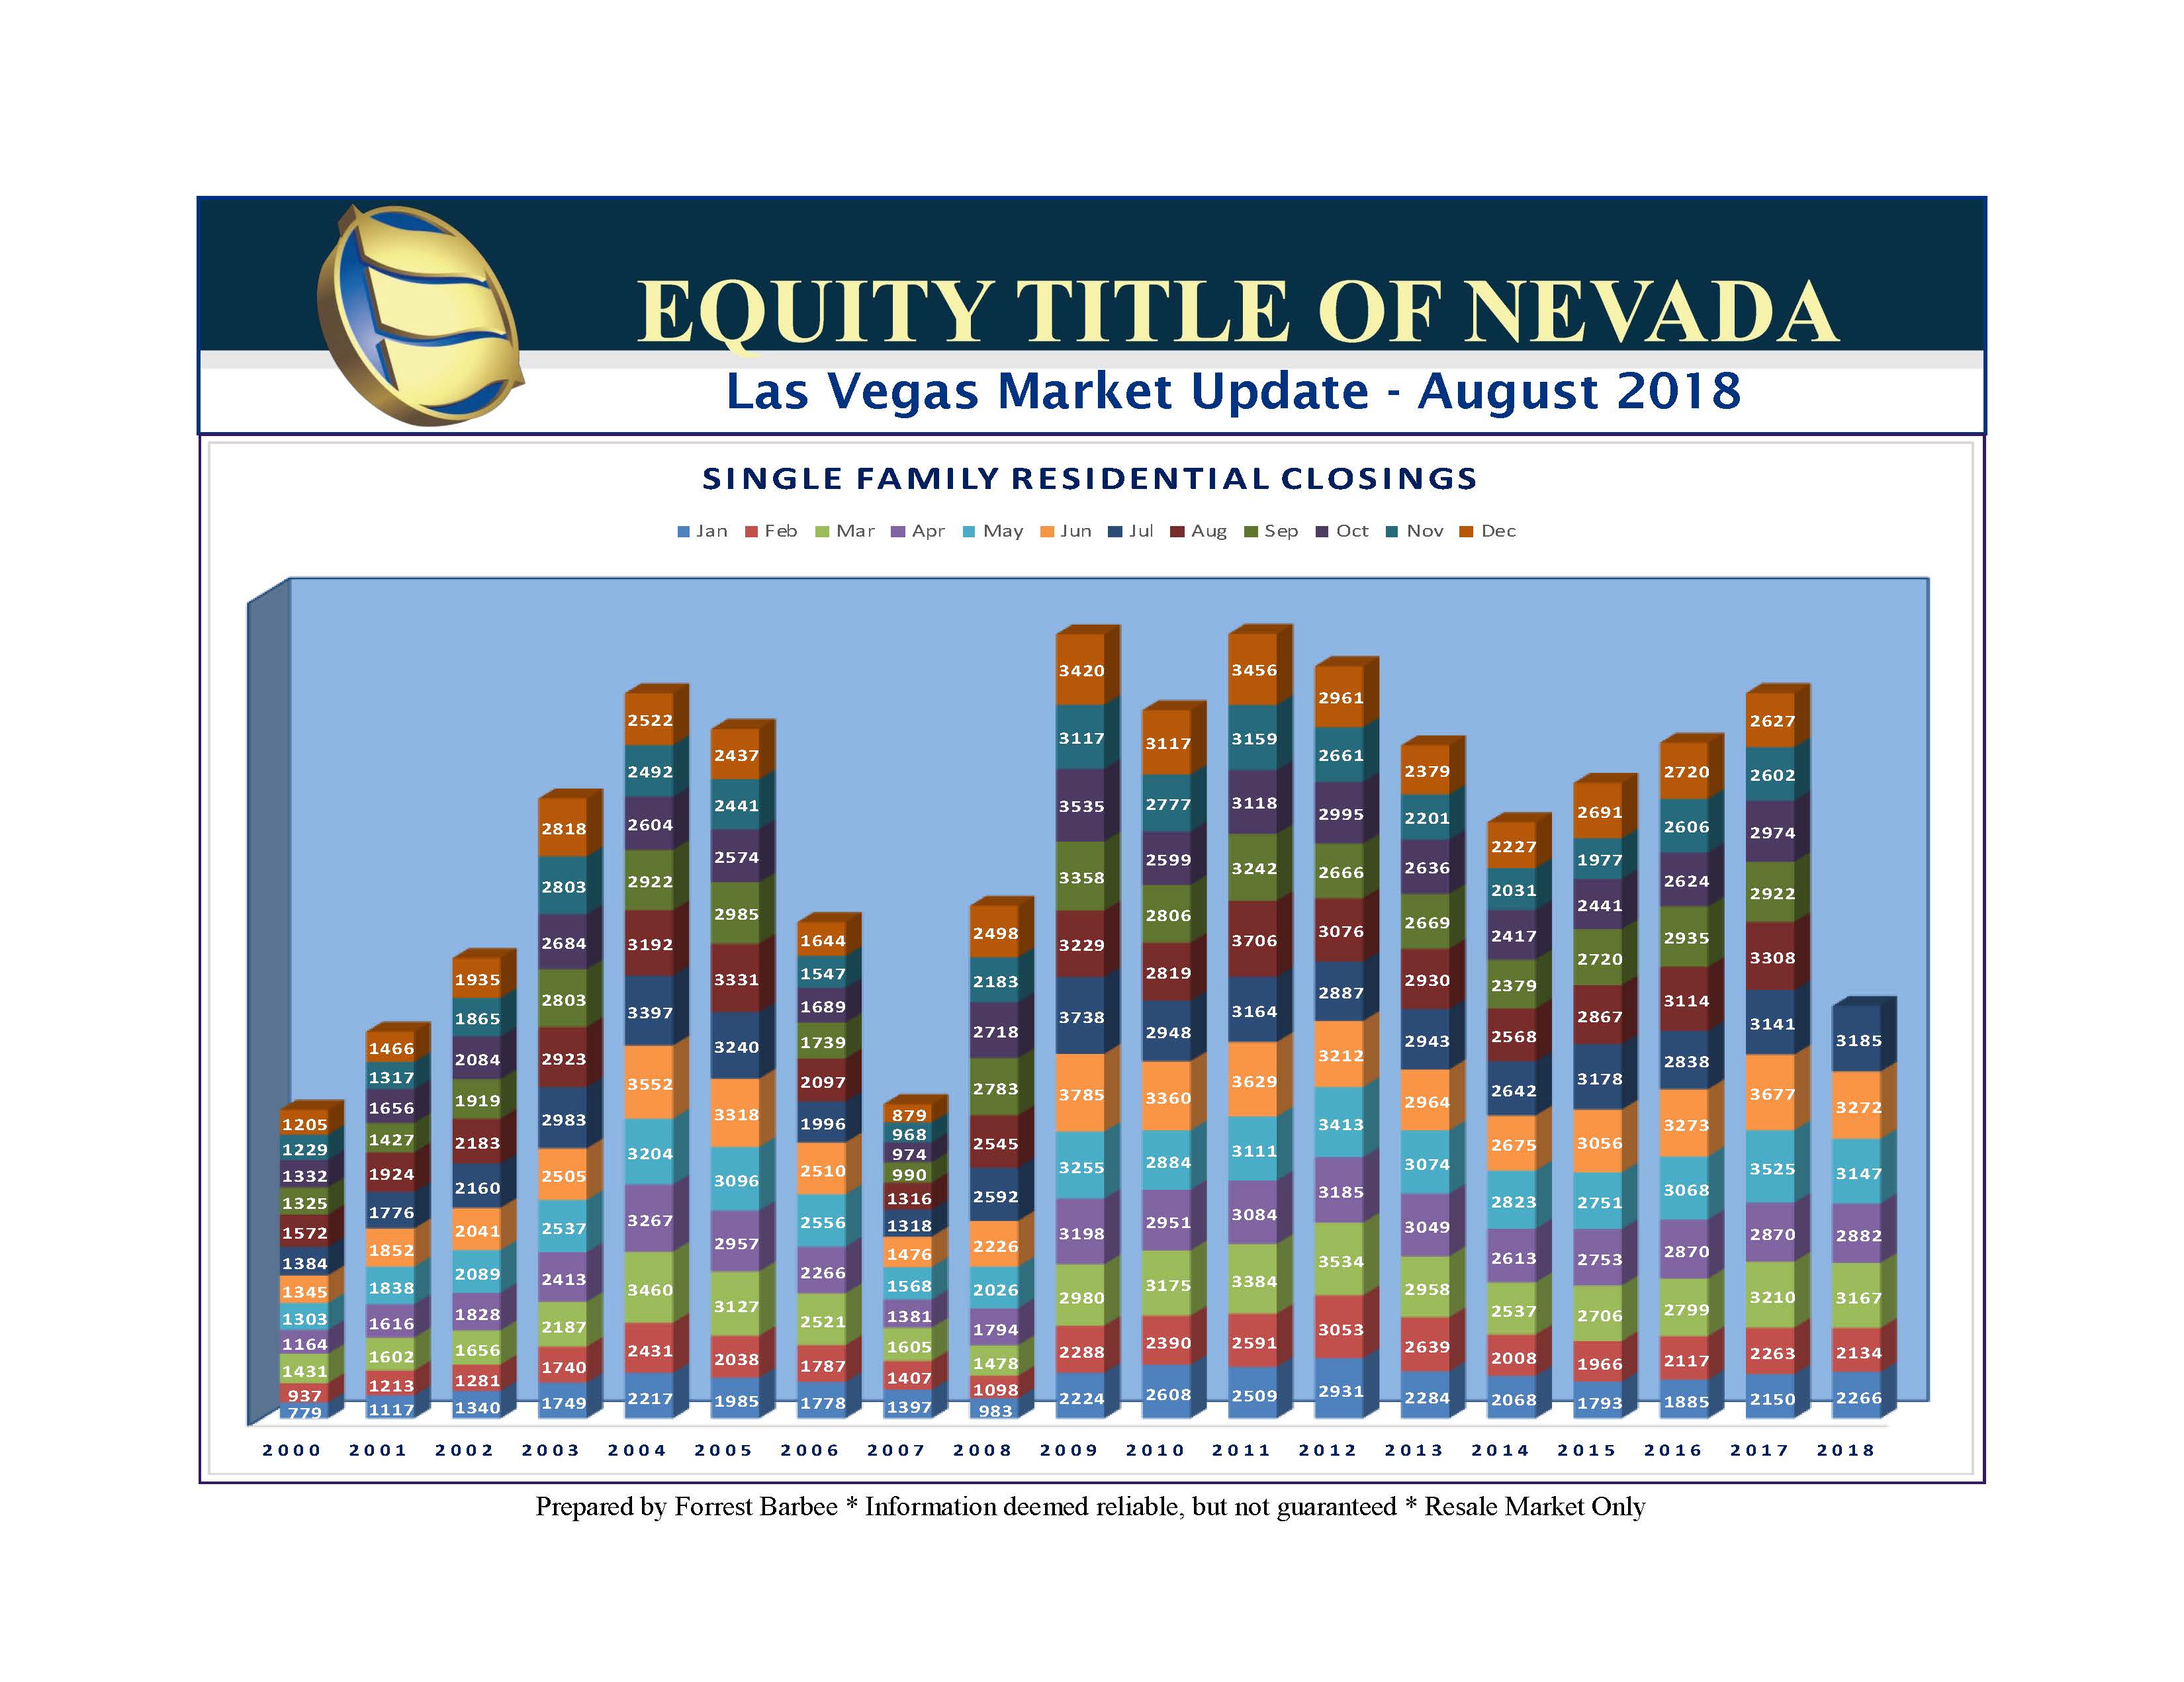

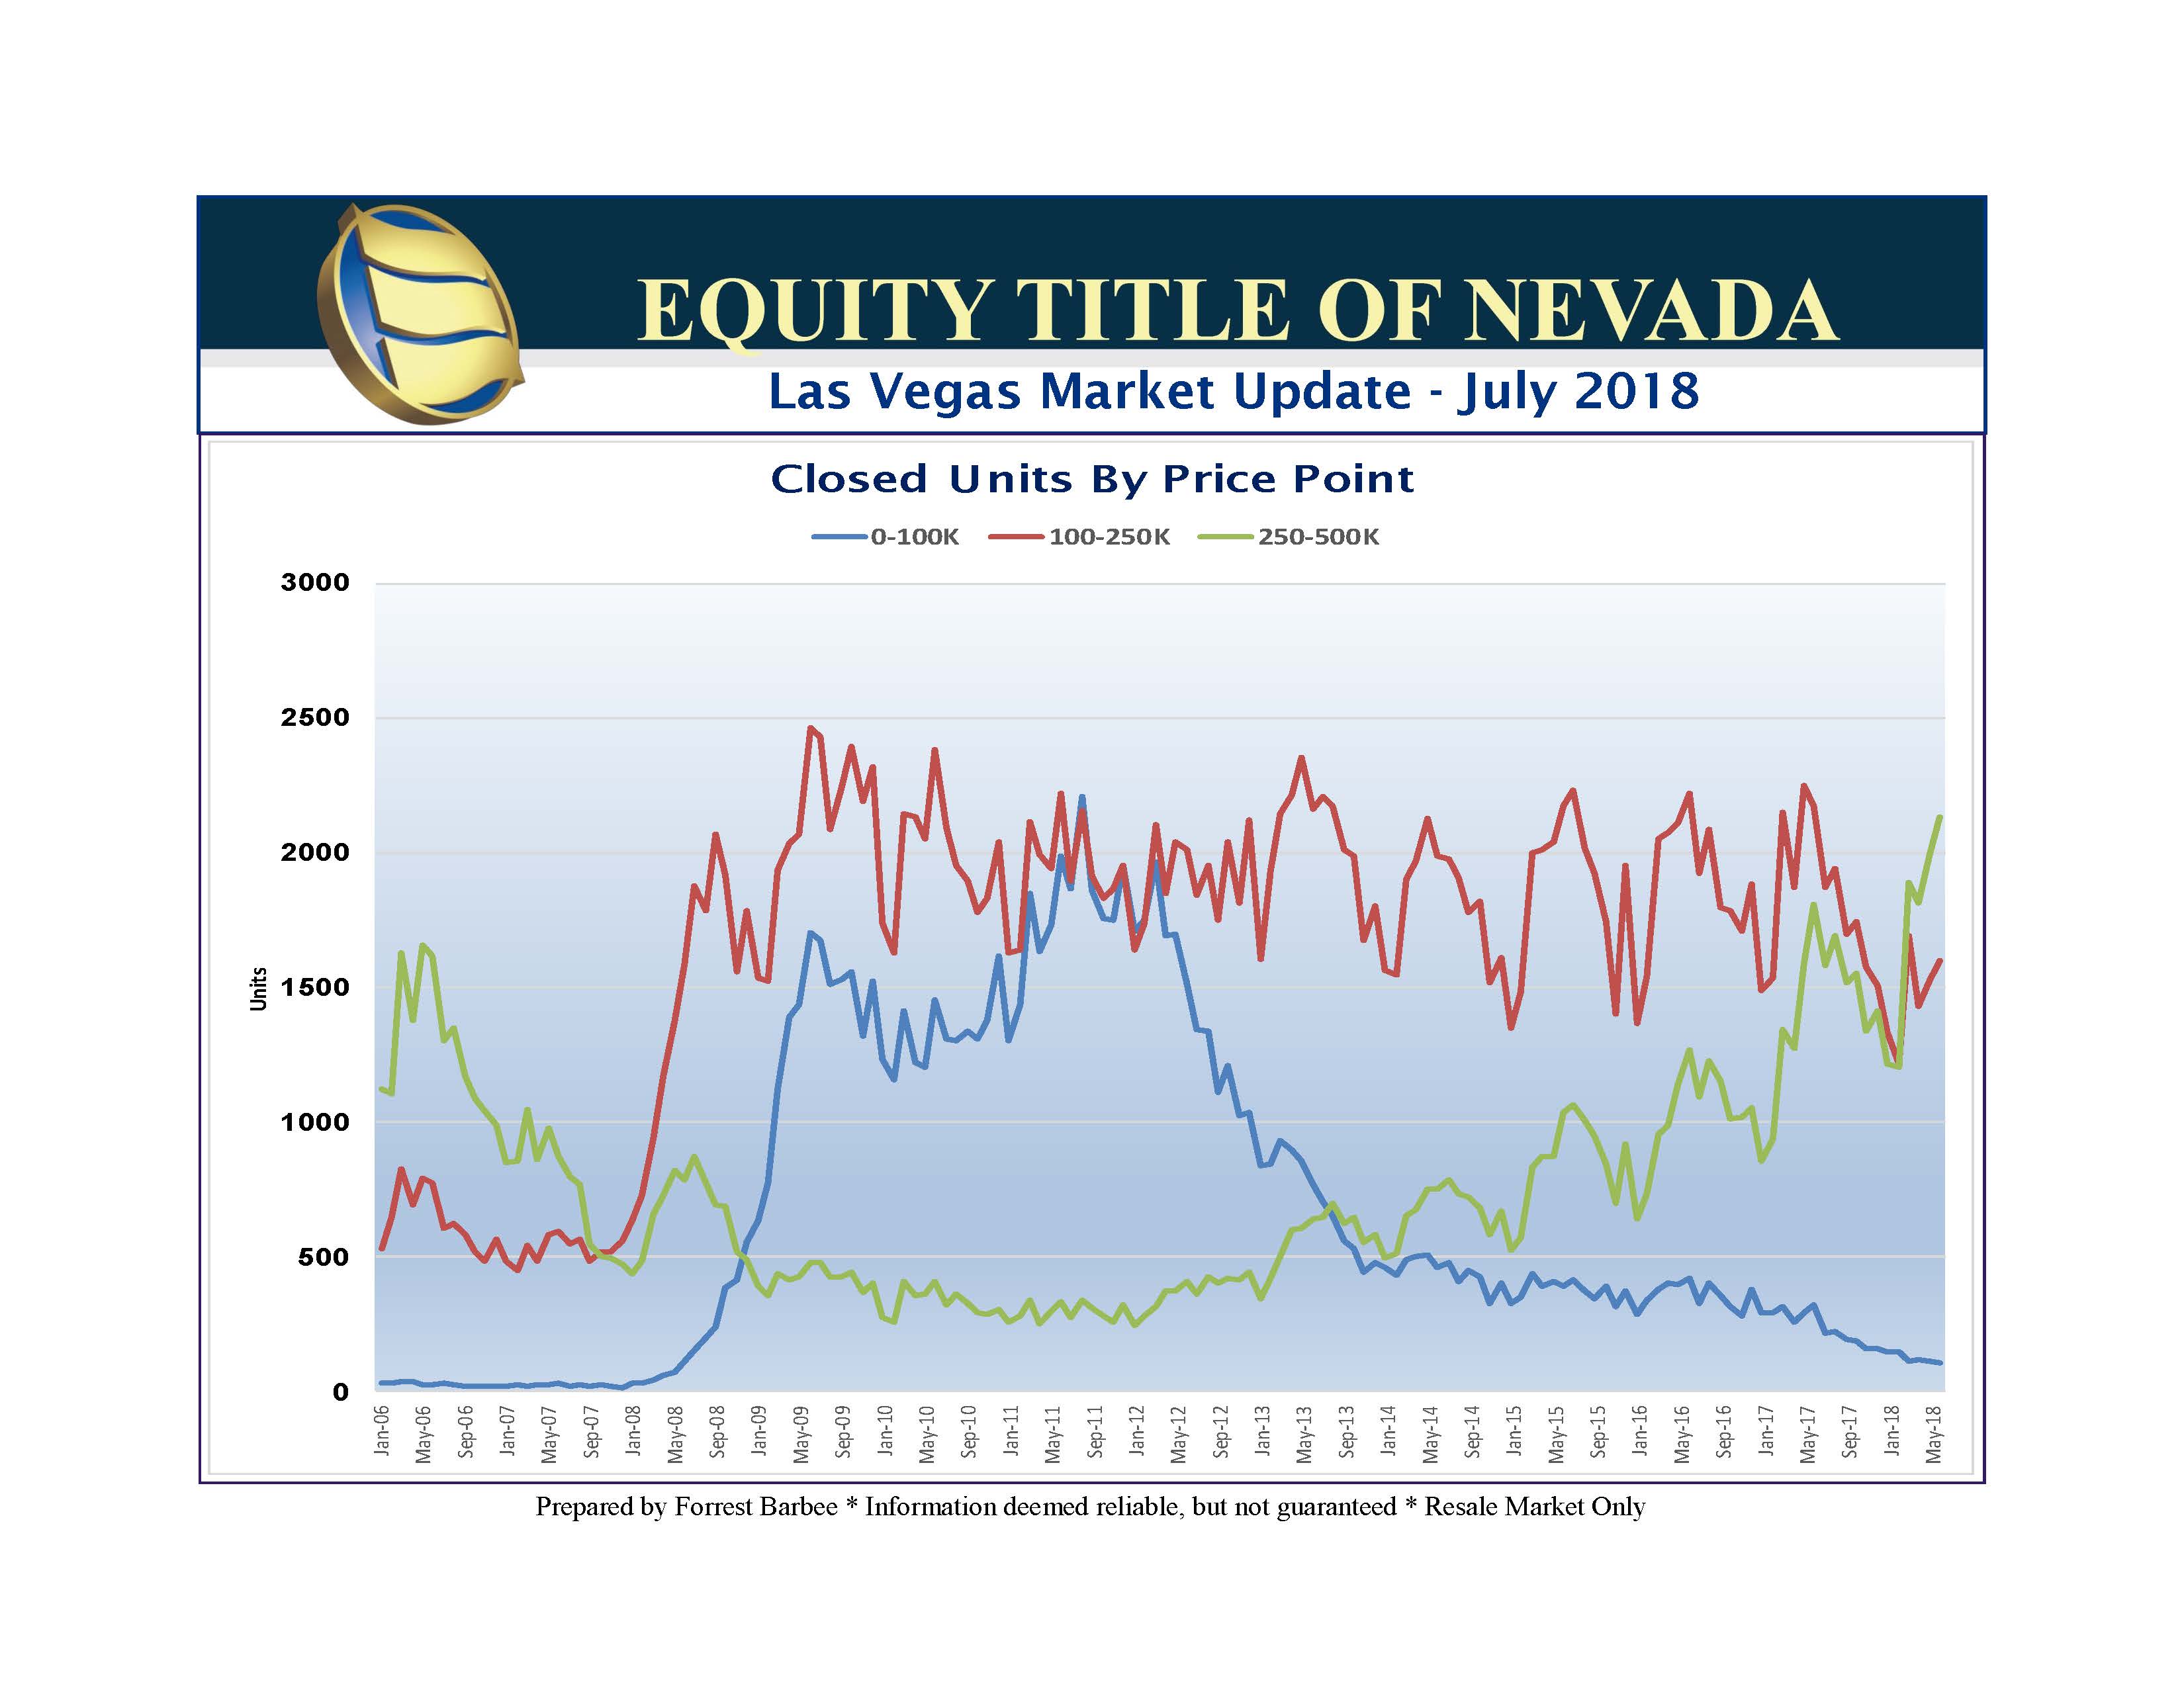
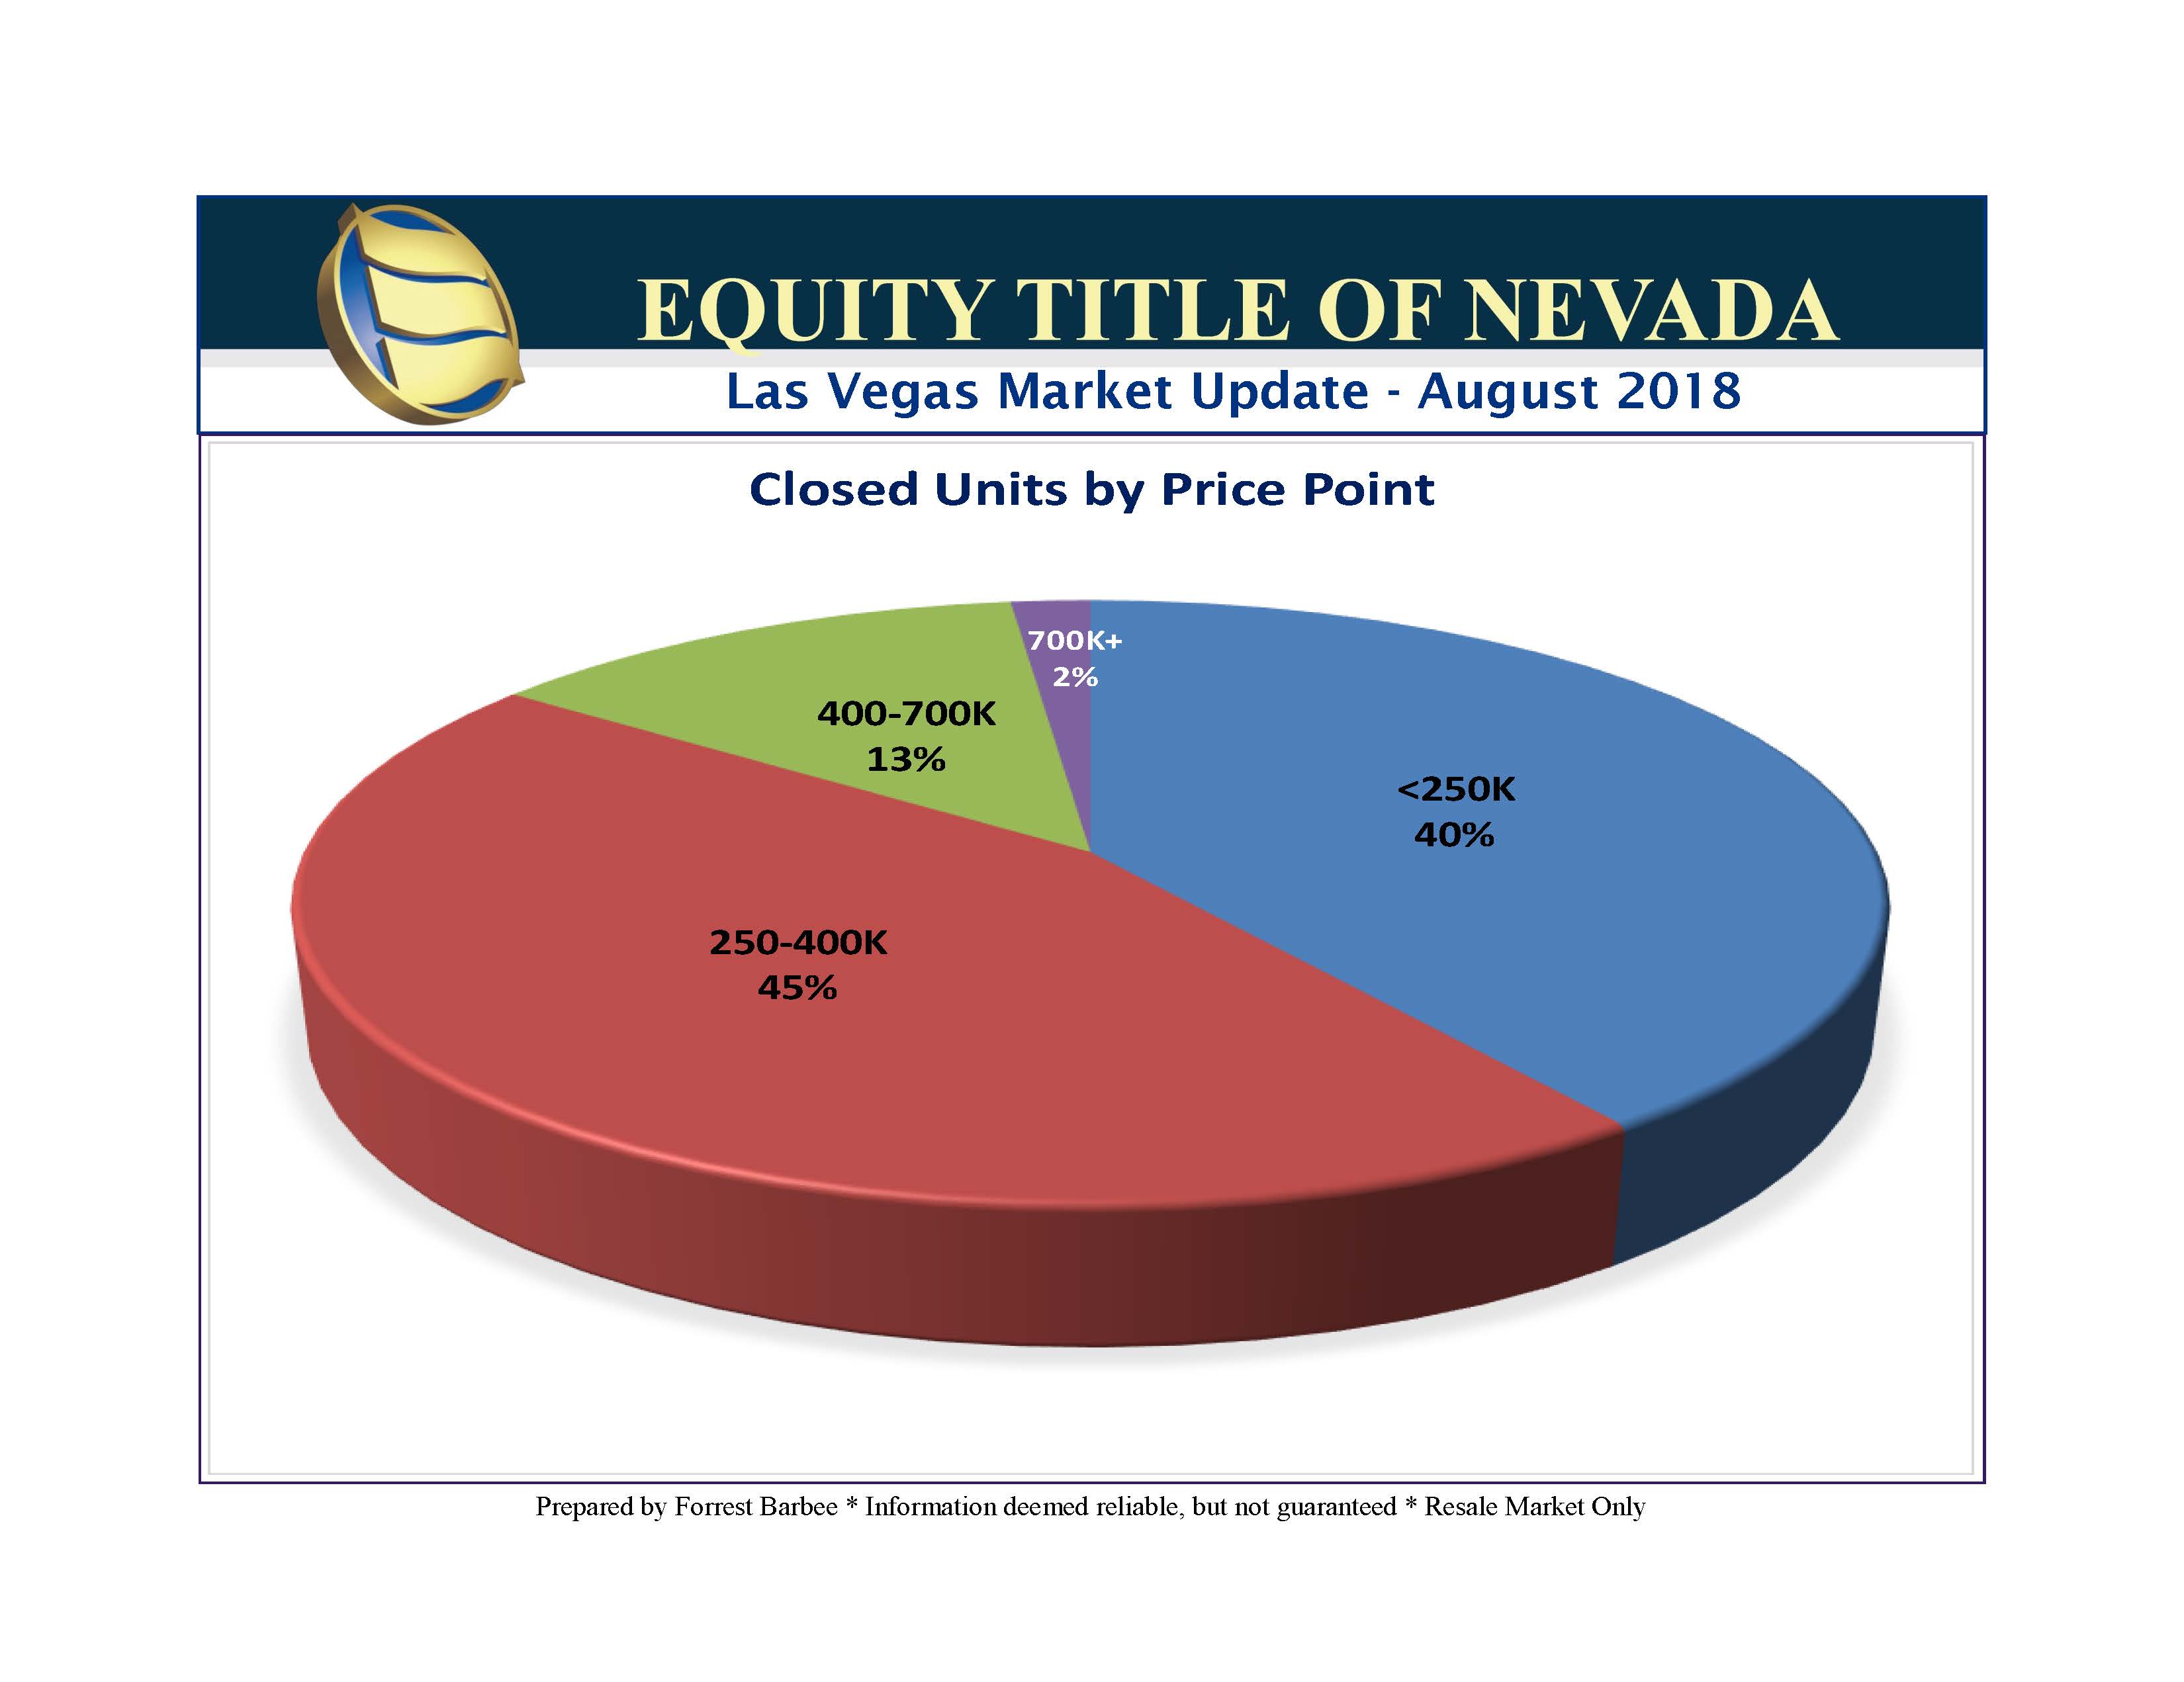
Residential Closings by Price Point
The four charts below clearly depict the shrinking inventory and closed sales for all residential homes below $250,000. The first chart illustrates how dominant sales were for properties below $250,000 and how those sales have steadily declines the past six years. The second chart illustrates that sales between $250,000 and $750,000 account for more closings than all sales below $250,000. This is the first time since mid-2007 that this was the case. The second chart below highlights the strong momentum for sales between $250,000 and $500,000 while the third chart shows the same thing for all sales over $500,000.


