The First Property Management Pre-Licensing Class for 2019

Las Vegas Market Overview
Click Here for the Current Las Vegas Market Individual Reports
Click Here for the Current Las Vegas Market Update Report
The Las Vegas real estate market in November struggled once again and lost ground from last year. In fact, it now appears that 2018 will end up much like 2014 or 2015, which would make it the first year the market has retreated in three or four years. November Single Family Residential (SFR) closed sales were down 14.8% from October 2018 and down 11.8% for the same period last year. The SFR median sales remained flat at $295,000 while the SFR average closing price retreated to $341,843 for a 2.6% drop from last month. Residential inventory continues to rise leaving the SFR market with 3.2 months of inventory. Unfortunately, the amount of SFR overpriced listings rose sharply to 67% of what is available. So let’s take a closer look at that!
A Fresh Look at Over Pricing in the Current Las Vegas Real Estate Market
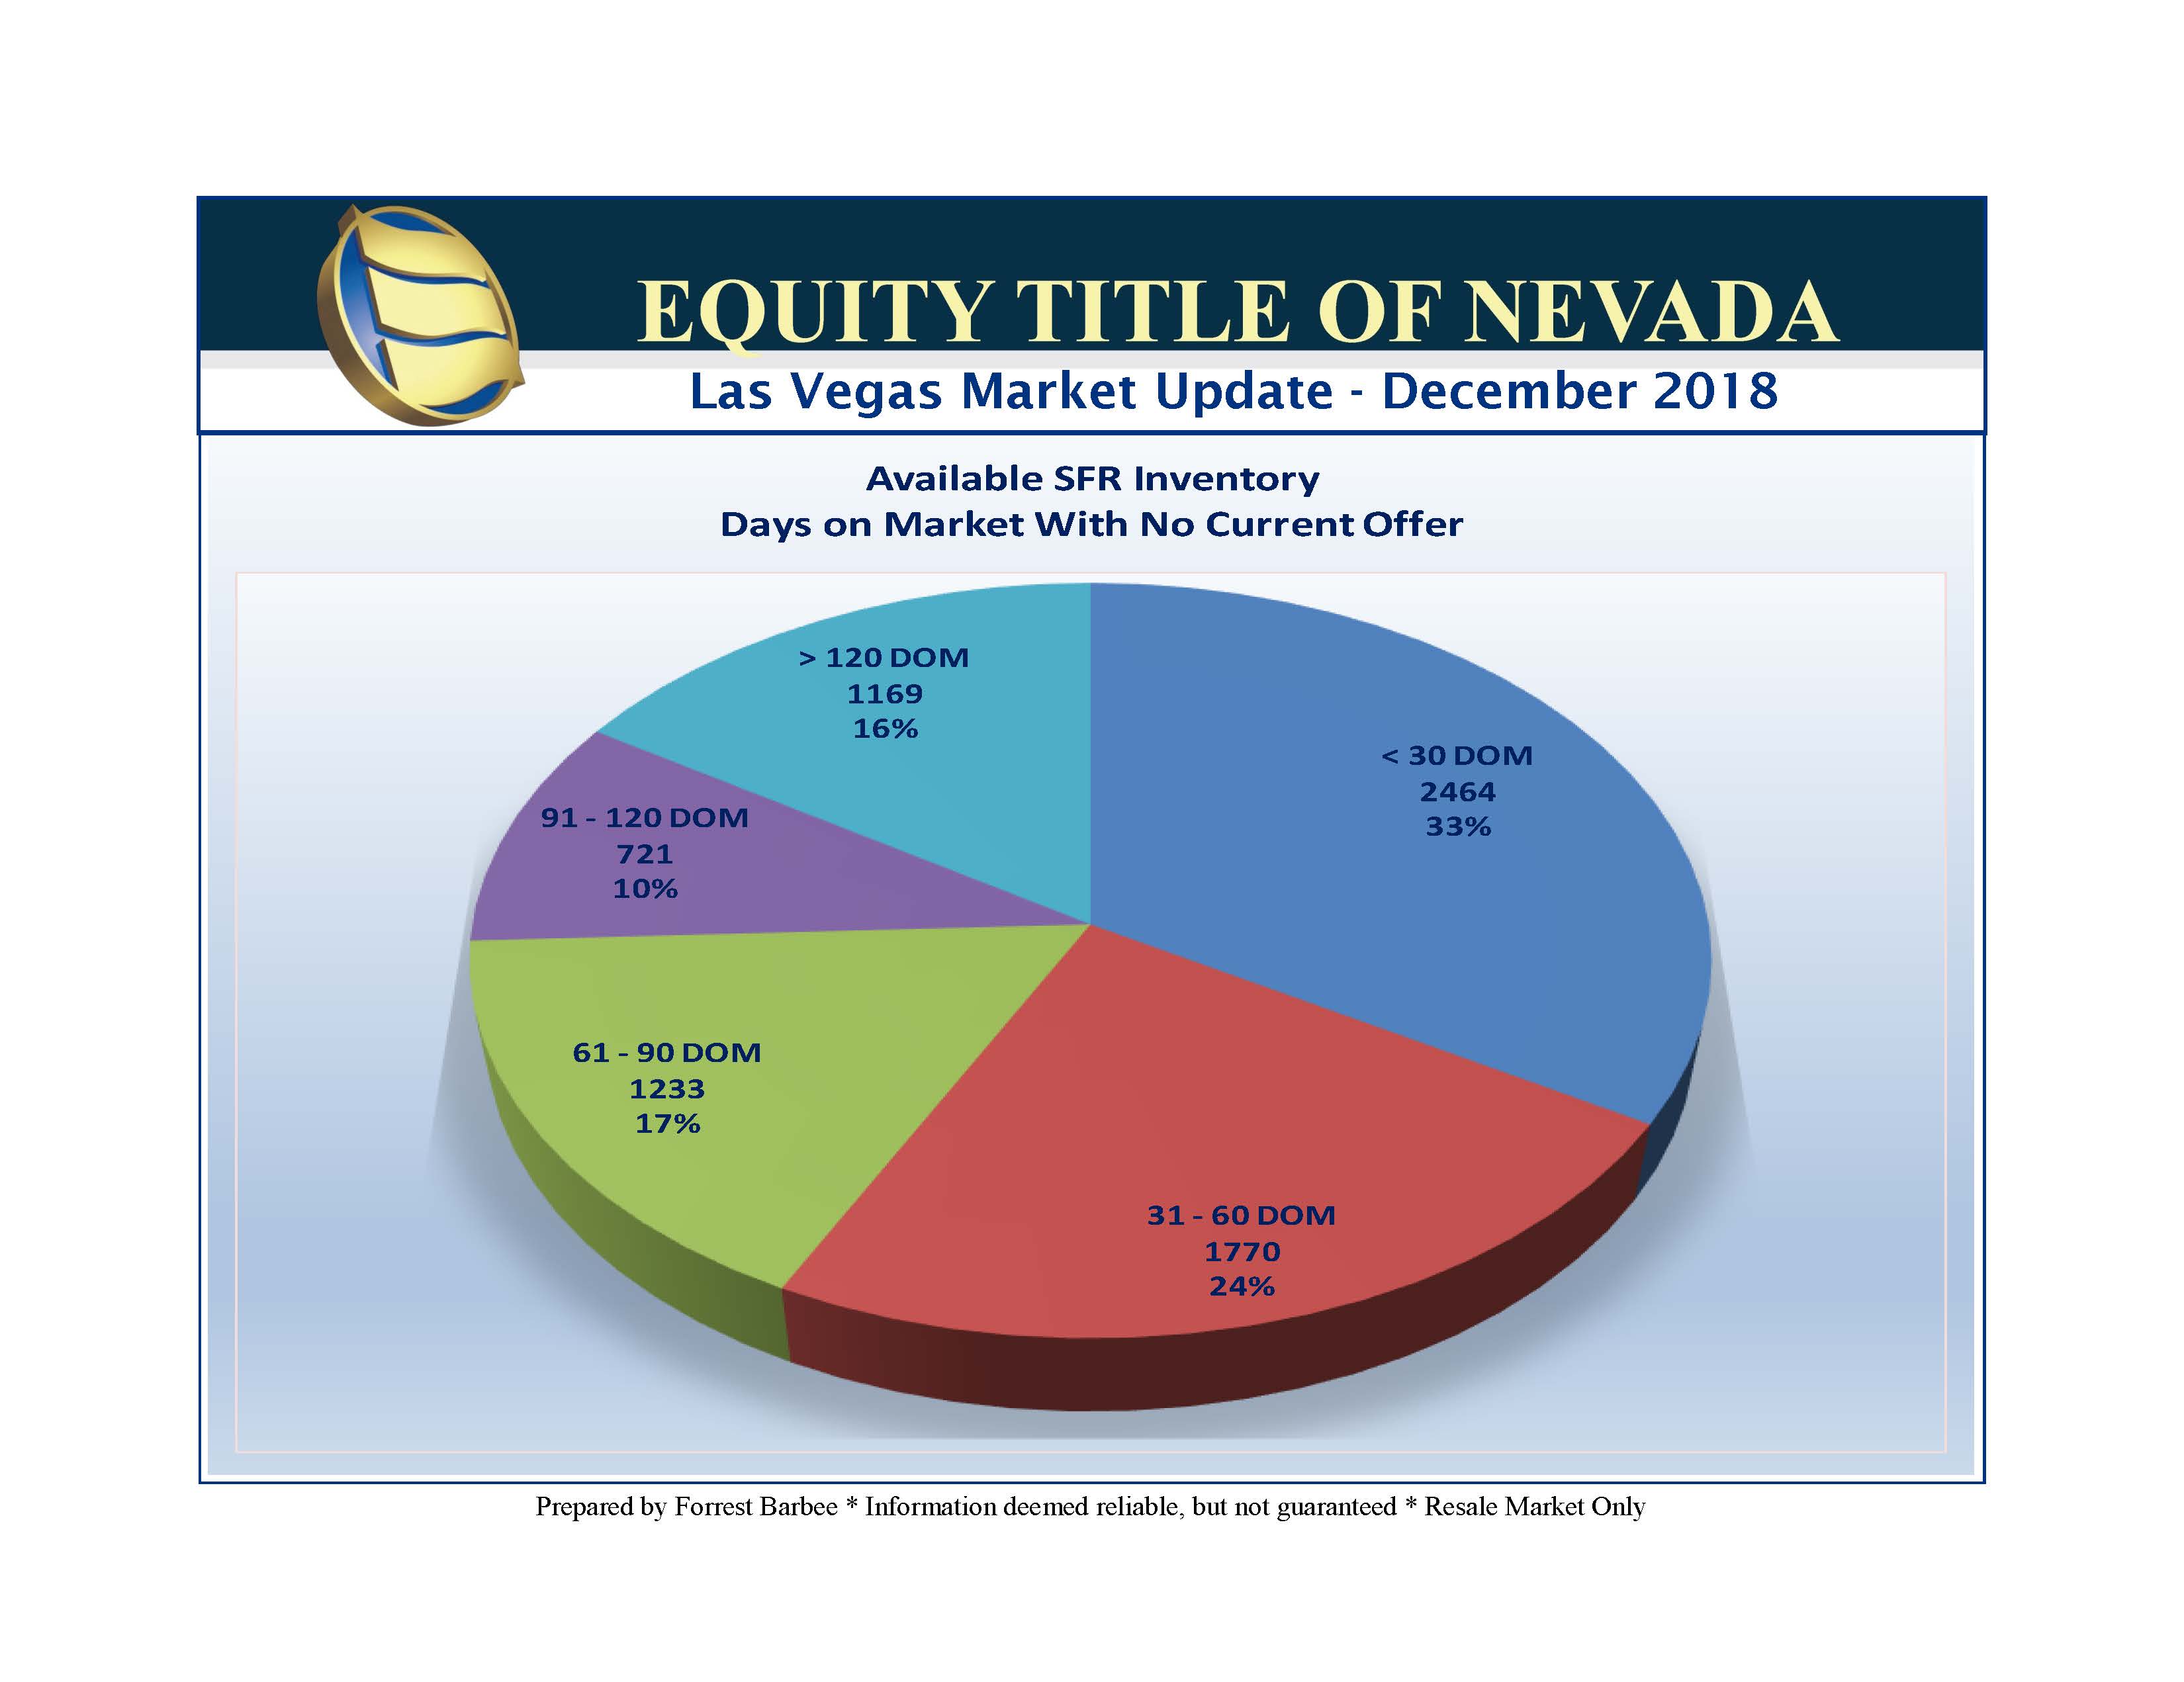
My Over Pricing Index has consistently been a reflection of Available SFR listings that have been on the market more than thirty days and do not have an offer. However, as the Over Pricing Index percentage has increased, it seemingly skews the amount of over pricing per property. The reason for this is that the newer listings are priced much closer to the actual market and generally sell within 30 days or less while the “really” over priced listing sit for months – or even years – but continue to be counted each month. Thus, on one hand this chart is accurate, but is not depicting the price pressure on new listings that are wringing out some of the over pricing. This chart better illustrates the headway we are making each month as it shows downward pressure on listing prices even as the closed sales price is rising. So the gap now between listings taken and listing sold is less than $20,000. Yet the amount of over priced listings has risen to 67% – 2 out of 3! Many of those are grossly over priced and have been on the market far too long. Both charts are correct, but show different aspects of the issue. However, I will now be using the two charts below to better highlight the Over Pricing Index. For example, 33% of the available listings are priced to sell, but 16% are clinging to prices that have guaranteed they remain on the market for at least four months. Why is this a challenge? The current market enjoys 3.2 months of SFR inventory, but only 33% of those are priced to the market. Therefore, we still only have one month of marketable inventory!!