Current Las Vegas Market Individual Charts
Current Las Vegas Market Report
Market Overview
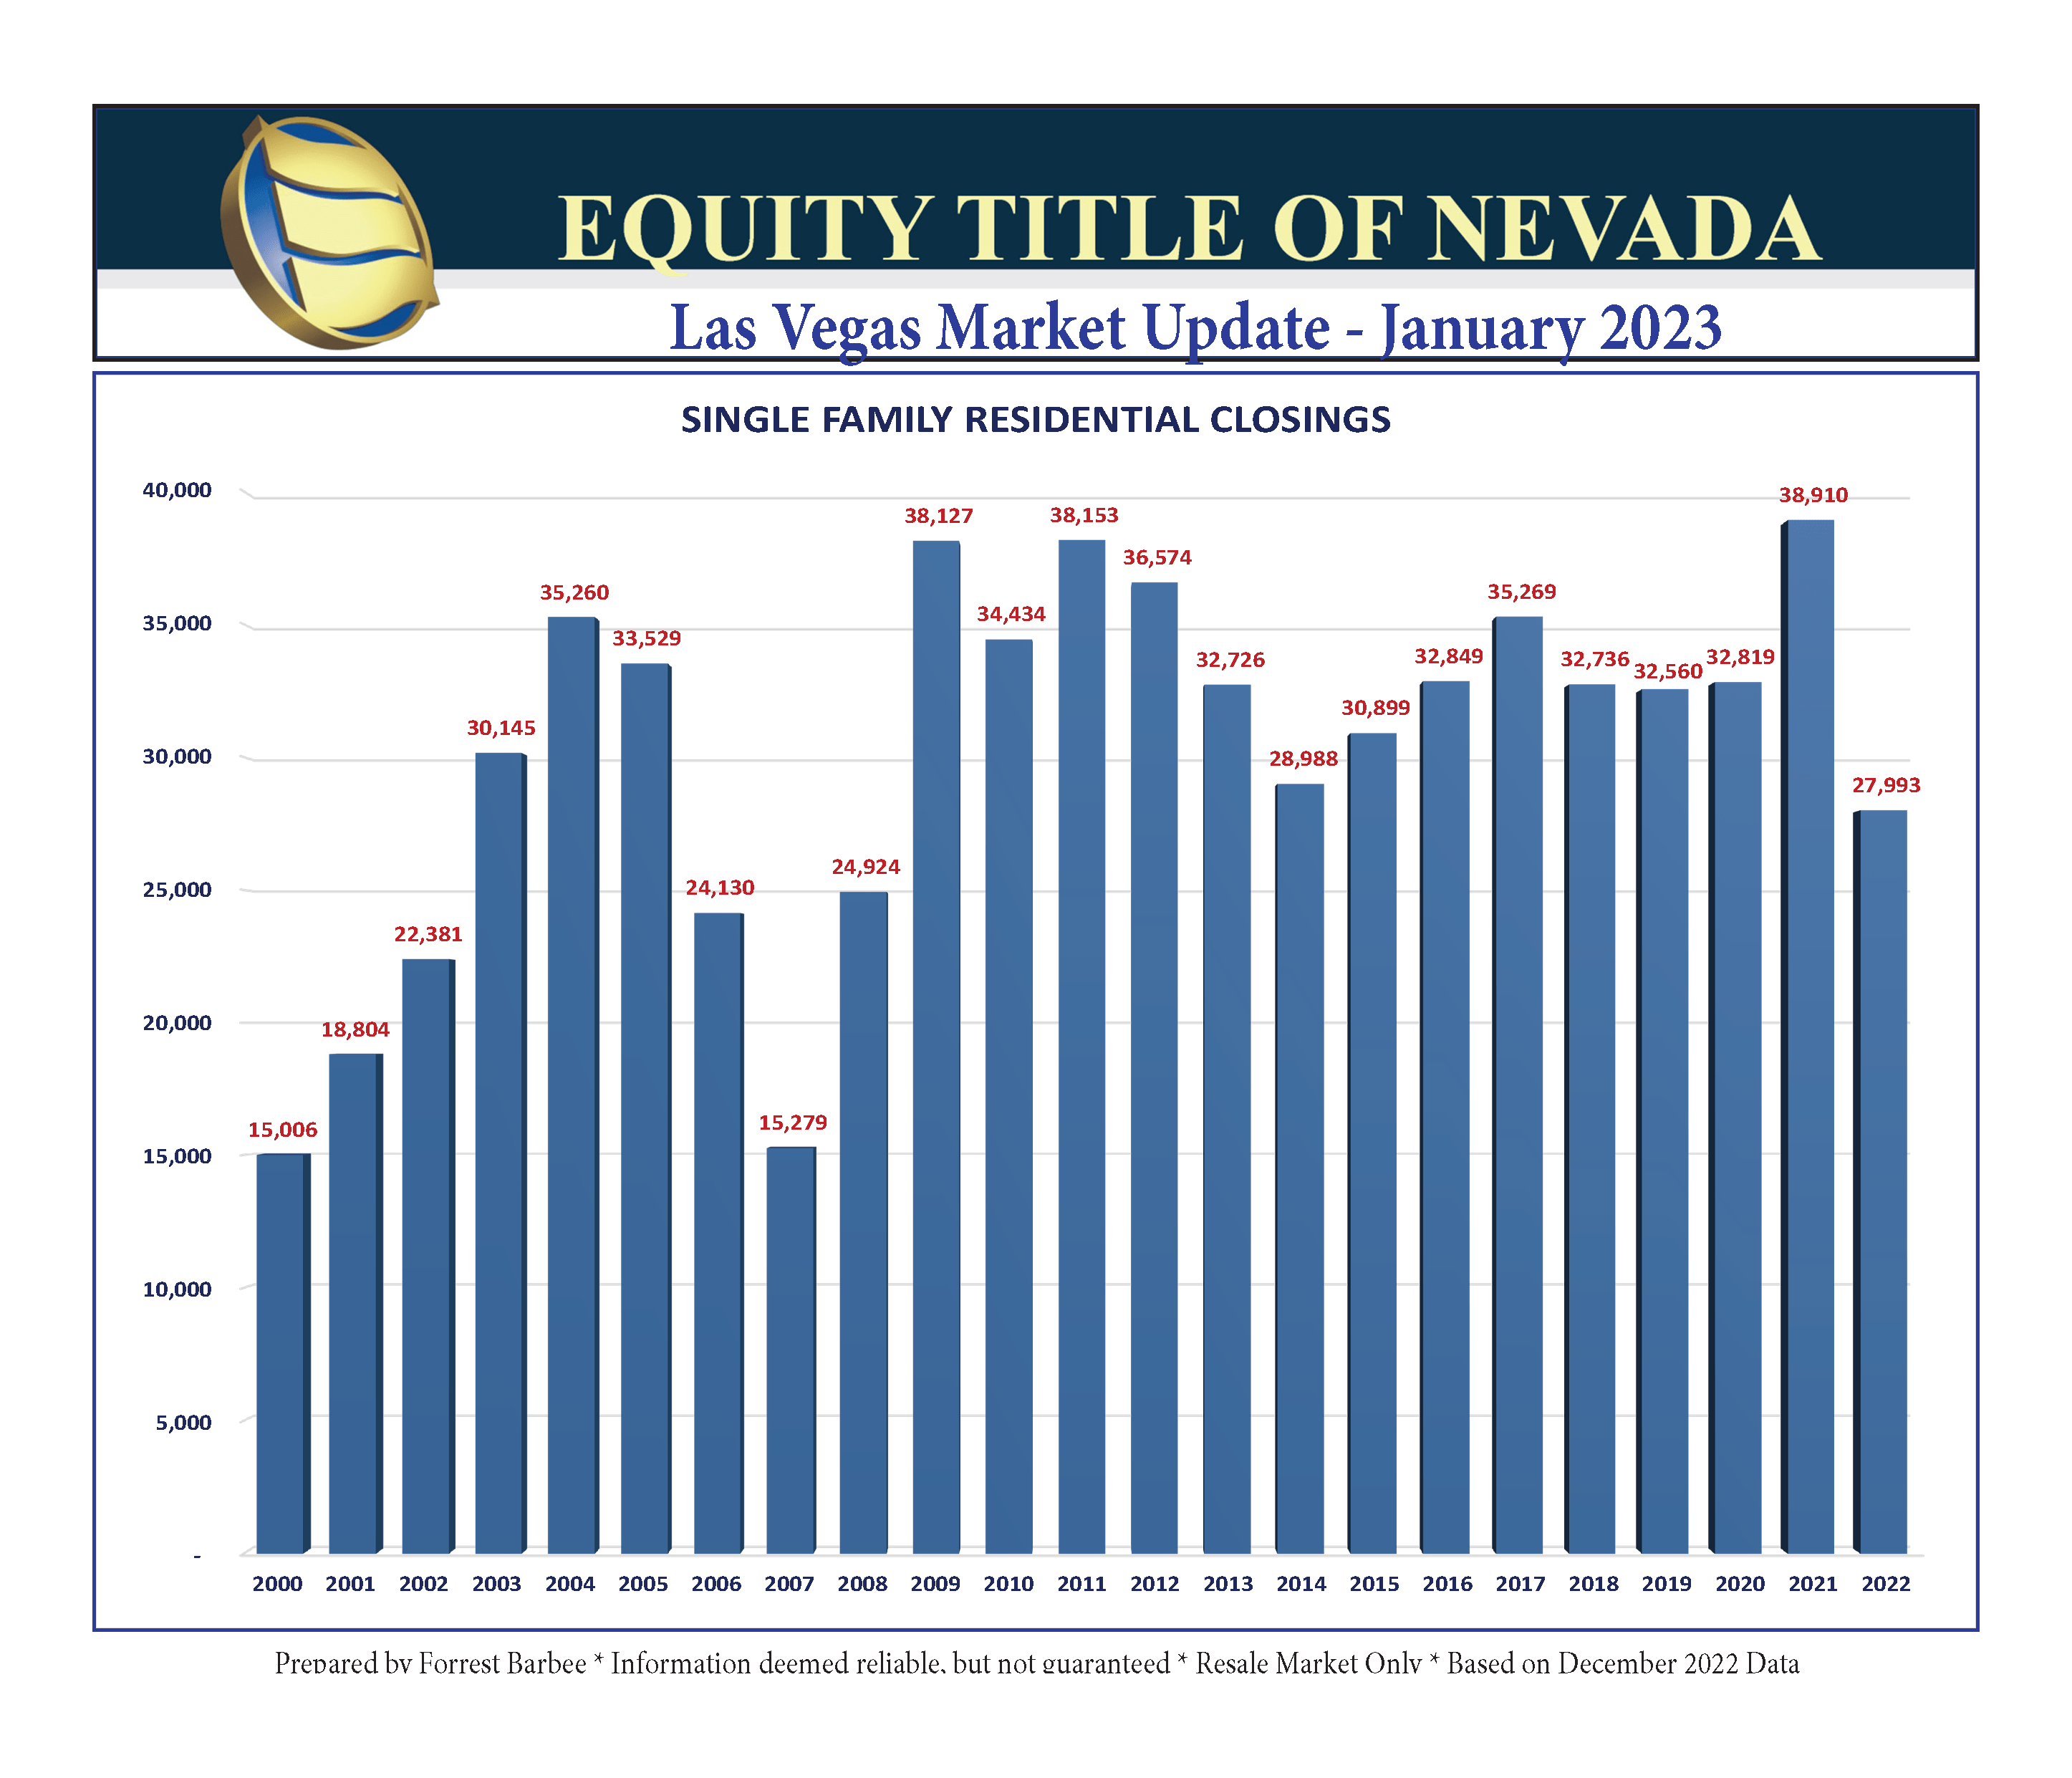
2022 closings ended up 26.7% behind the 2021 closings, which is slightly behind 2014. Listings taken, available listings, and homes in escrow all dropped significantly again in December. There are right at six months of inventory for SFR listings, but it ranges from 3 months to 15 months – not counting MacDonald Highlands.
The median sales price of SFR closings dipped from $430,495 to $425,000 while the SFR average closed sales price fell to $514,768 for an additional decrease of 2.6%. The last time that the median sales price of an SFR was $425,000 was one year ago in December 2021. The luxury market closings slipped to 67 in December and ended up slightly behind 2021. However, 2022 luxury market closings remain the second-highest year on record.
Advantage Buyers!
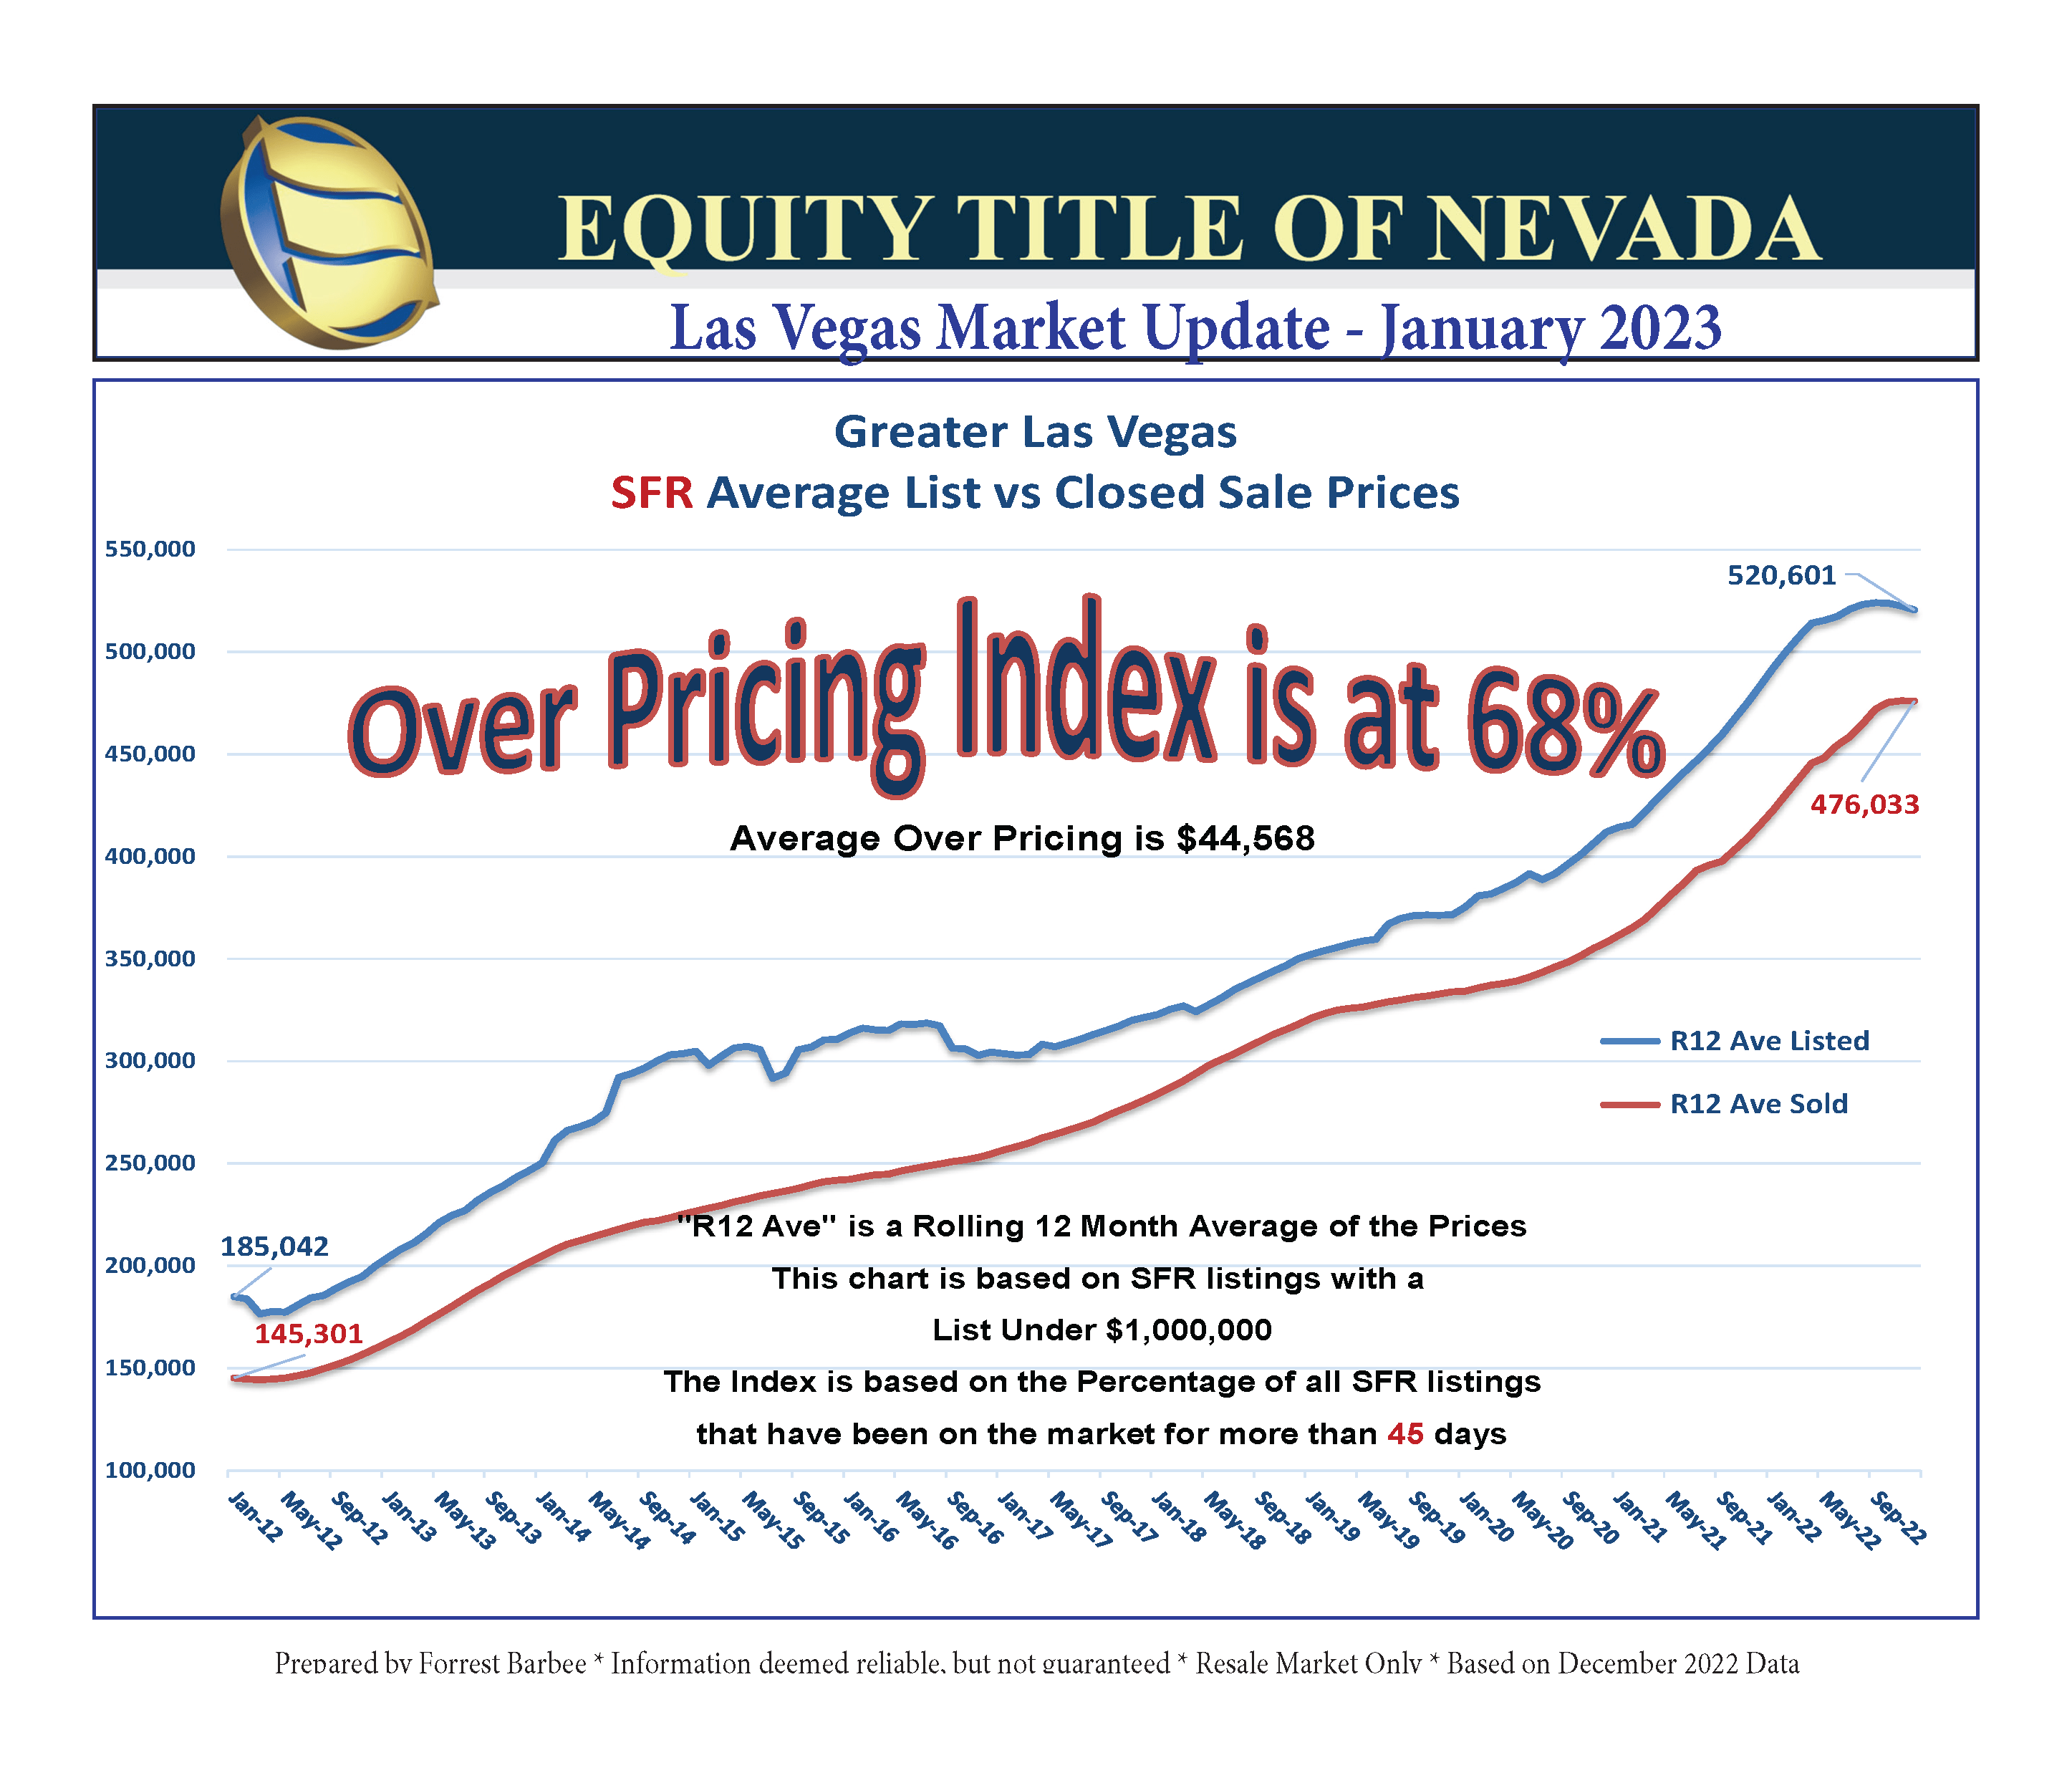
The real estate market has rapidly gone from only a few weeks of marketable inventory to right at six (6) months of inventory. That coupled with falling sales and a significant drop in listings taken have caused the over pricing index to jump to 68%. With six months of SFR inventory, buyers and sellers have nearly equal initial negotiating leverage in most communities throughout Greater Las Vegas.
Listing agents must seriously consider the current supply and demand profile when preparing a comparative market analysis for sellers. However, both Sellers and Buyers are anxious for the moment, so fasten your seatbelts as we cruise straight into 2023! One key right now is to properly price new listings. Perhaps it’s time to bring back my favorite video on this subject?
Clearly the market continues to adjust to the political, economic, and financial conditions that have been thrust upon us. The consumer as well as the real estate professionals will also adapt to these changes. For example, some potential buyers are sitting on the sidelines, but others are moving forward with perhaps a smaller house for now with the belief that one day they will be able to refinance into a better mortgage. Others are considering attached homes as we see the condo and townhome sales continue at a very good pace. Yet, it should be noted that conventional financing came on strong in December despite the rate hike roller coaster ride.
Most importantly – even as we see sales potentially slowing for a while, we will not revisit the market collapse of 2007! This market has challenges but is far healthier than that! The closing “brakes” are on, but the market is not fraught with the same forces and variables that created the 2007/2008 market problems! Take note of the last chart which depicts some of the Case-Shiller Indices through October 2022. The dotted red and dark blue lines represent 4% and 6% appreciation respectively. The chart illustrates purchasing a home in January 2000 and what the return on that investment looks like over time. The market over-heating during the 2004 through 2006 years jumps right off the chart. By comparison, the over-heating these past few years is mild by comparison and the welcome corrections have already begun. It also shows that if you purchased a home in January 2000 and held onto it, that – generally speaking – your average annual appreciation would end up somewhere between 4% and 5% depending on your specific market. During that time both Phoenix and Las Vegas spent years well below the 4% return threshold. Thus, some of the appreciation runup may be chalked up to simply catching up.
More importantly, do not pay that much attention to media articles that are gloom and doom – even if they are sprinkled with some factual elements. If that fails – please treat yourself to a full news blackout – and make a few more sales instead! LOL


Looking Back at the Market – 10 Years Ago
Property Management Permit Pre-Licensing Class
24 Hour Online Format

Online Continuing Education Class – Broker Management

