 Overpricing Overview
It’s time to address the overpricing issue head on! Why do so many listing agents denigrate “low ball” offers and simultaneously tolerate “overpriced” listings? The chart below illustrates that the over pricing gap has closed a little since the beginning of 2012. While that is true – don’t be fooled into thinking that the current gap of $165,000 is reason the celebrate! In 2012 – even with the overpricing – 91% of all Single Family Residences (SFR) that were listed resulted in a closed sale. The statistic dropped to 80% in 2013 and is now only 70%. On the surface that might not make sense when studying the chart below. However, the chart does not provide us any information regarding supply and demand. Just one year ago the Greater Las Vegas market only had a 1.7 – 2.0 months supply of SFR inventory against a strong demand. We are currently and 2.8 months of supply and growing. Sellers at most price points in the current market no longer have the leverage to command overpriced offers based solely upon scarce inventory. Perhaps it’s time to have a heart to wallet discussion with some of your sellers – today?
 The Current Las Vegas Market
Closed sales for Year-To-Date 2014 remain 12.6.% behind last year as we enter into August. The median sales price of an SFR improved to $200,000 while the average closed sales price remained flat at $240,000. However, the closed sales price of a traditional SFR dropped to $253,000. Only REO closings put upward pressure on closing prices during July.
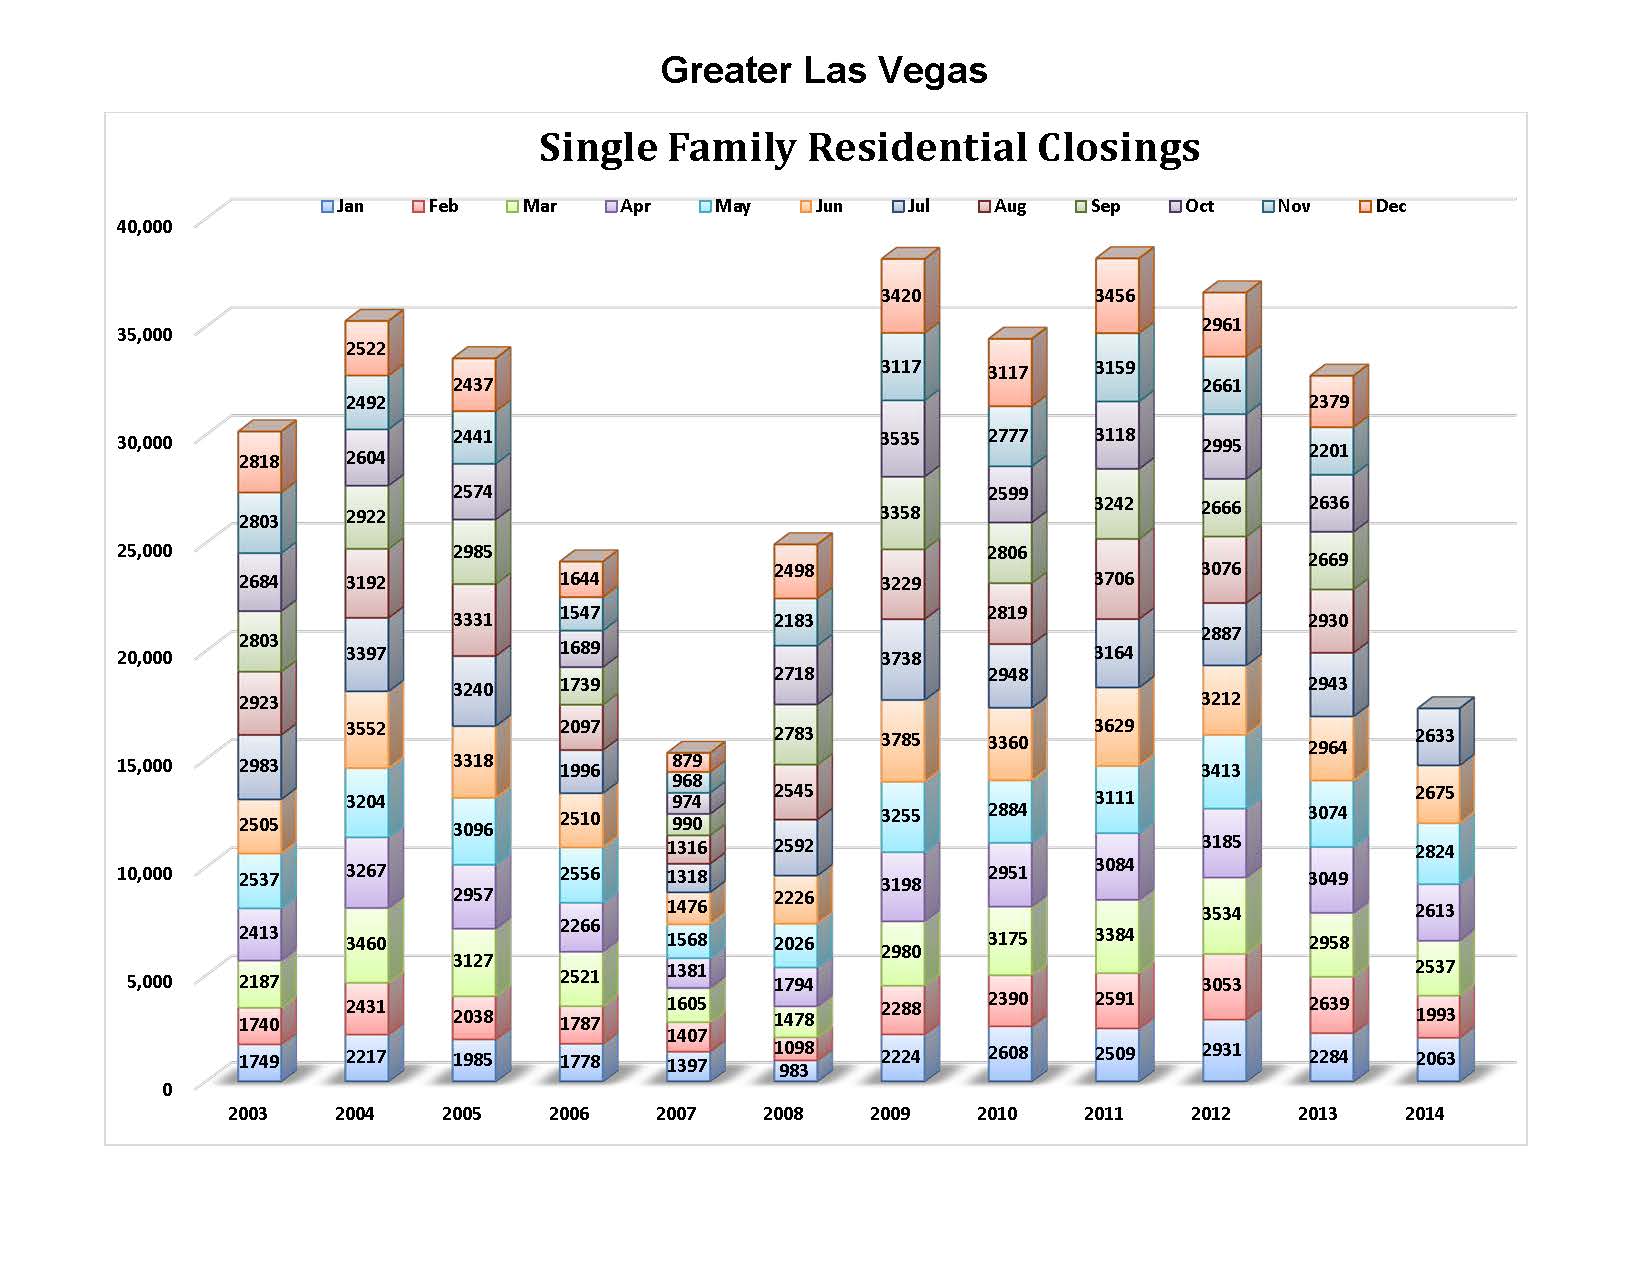 We have witnessed the continue contraction of closed units since 2011. For example, 2013 was down 15% in units closed versus 2012. However, closed units for homes $200,000 and over were up nearly 50% in the first seven month of 2013 compared to 2012. The chart below compares each of the last four years for the period from January to July within each year. This would suggest that those agents with average listings above $200,000 should actually have grown listing inventory and closed more units than previously! Again, please do not fall into the trap of superficially looking at the local real estate market from a macroscopic perspective. In this case – when we drill down – we find that there are many more closed units above $200,000 despite what the market has experiencing on the whole. What does your inventory look like?
 The supply of SFR homes increased to 2.8 months in July. This growing inventory is bringing the local market into a more balanced market in terms of supply and demand. Still, be sure to analyze by subdivision or community to get a better picture of supply and demand for your listings and sales.
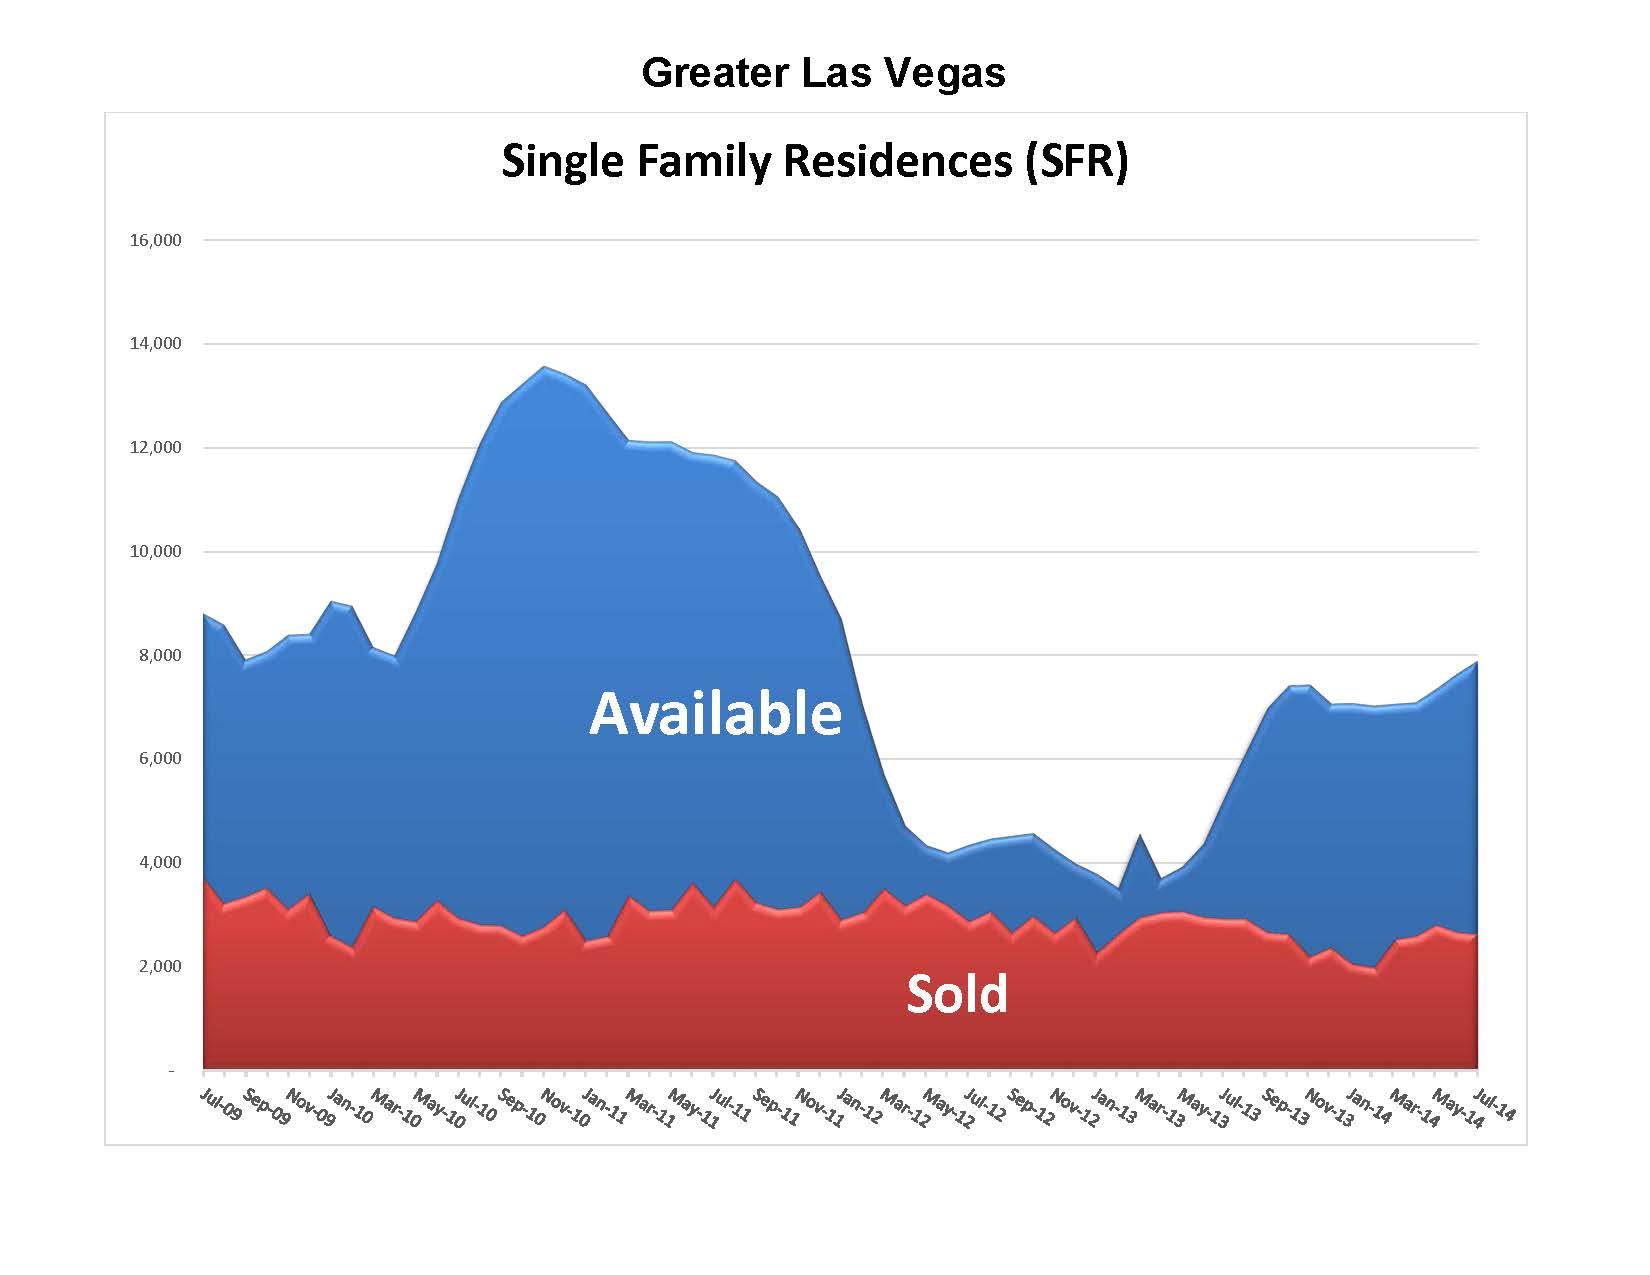 Las Vegas enjoys numerous “micro climates” when it comes to market appreciation or depreciation. This epitomizes the notion that “all real estate is local”! Very local when evaluating Greater Las Vegas market pricing.
Click Here to Download the Current Las Vegas Market Update
Click Here for Additional Las Vegas Market Update Charts
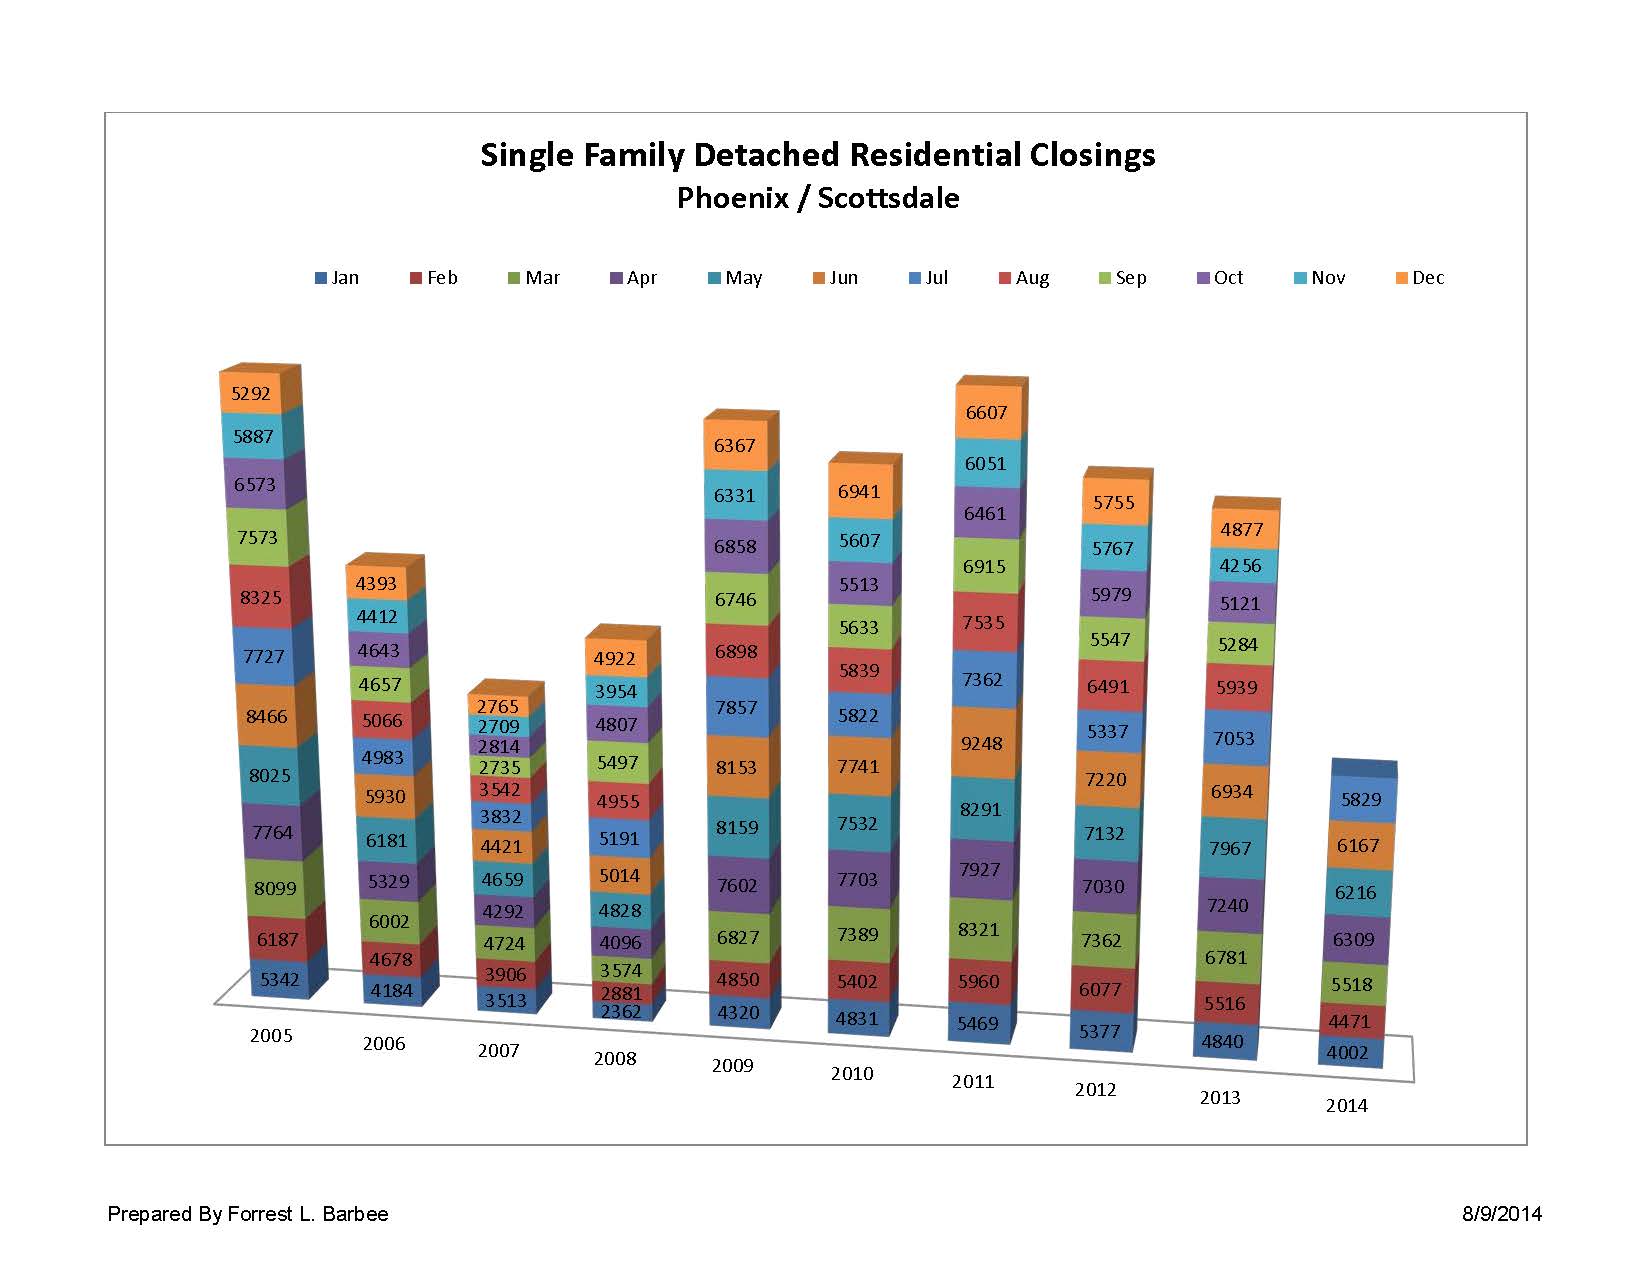
So What’s Happening in Phoenix/Scottsdale?
The Phoenix Market is now made up of 90% non-distressed sales. In turn, this has greatly improved the financing situation with 74% of all July closings being financed. Closed sales prices continue to drift sideways with the current median sales price of a single family detached home being $210,000 and the average sales price dipping to $273,165.
There was a long period of time where the Phoenix/Scottsdale market was running about 6-8 months ahead of Greater Las Vegas. However, the Greater Las Vegas market is more rapidly shifting away from a non-distressed market with only 22% of the market being made up of REO and short sales. It appears that the two markets are close to being in lock step with one another.
Click Here to Download the Current Phoenix/Scottsdale Market Update
Click Here for Additional Phoenix/Scottsdale Market Update Charts