Market Overview – Lockdown Edition
Click Here for the Current Las Vegas Market Individual Reports
Click Here for the Current Las Vegas Market Update Report
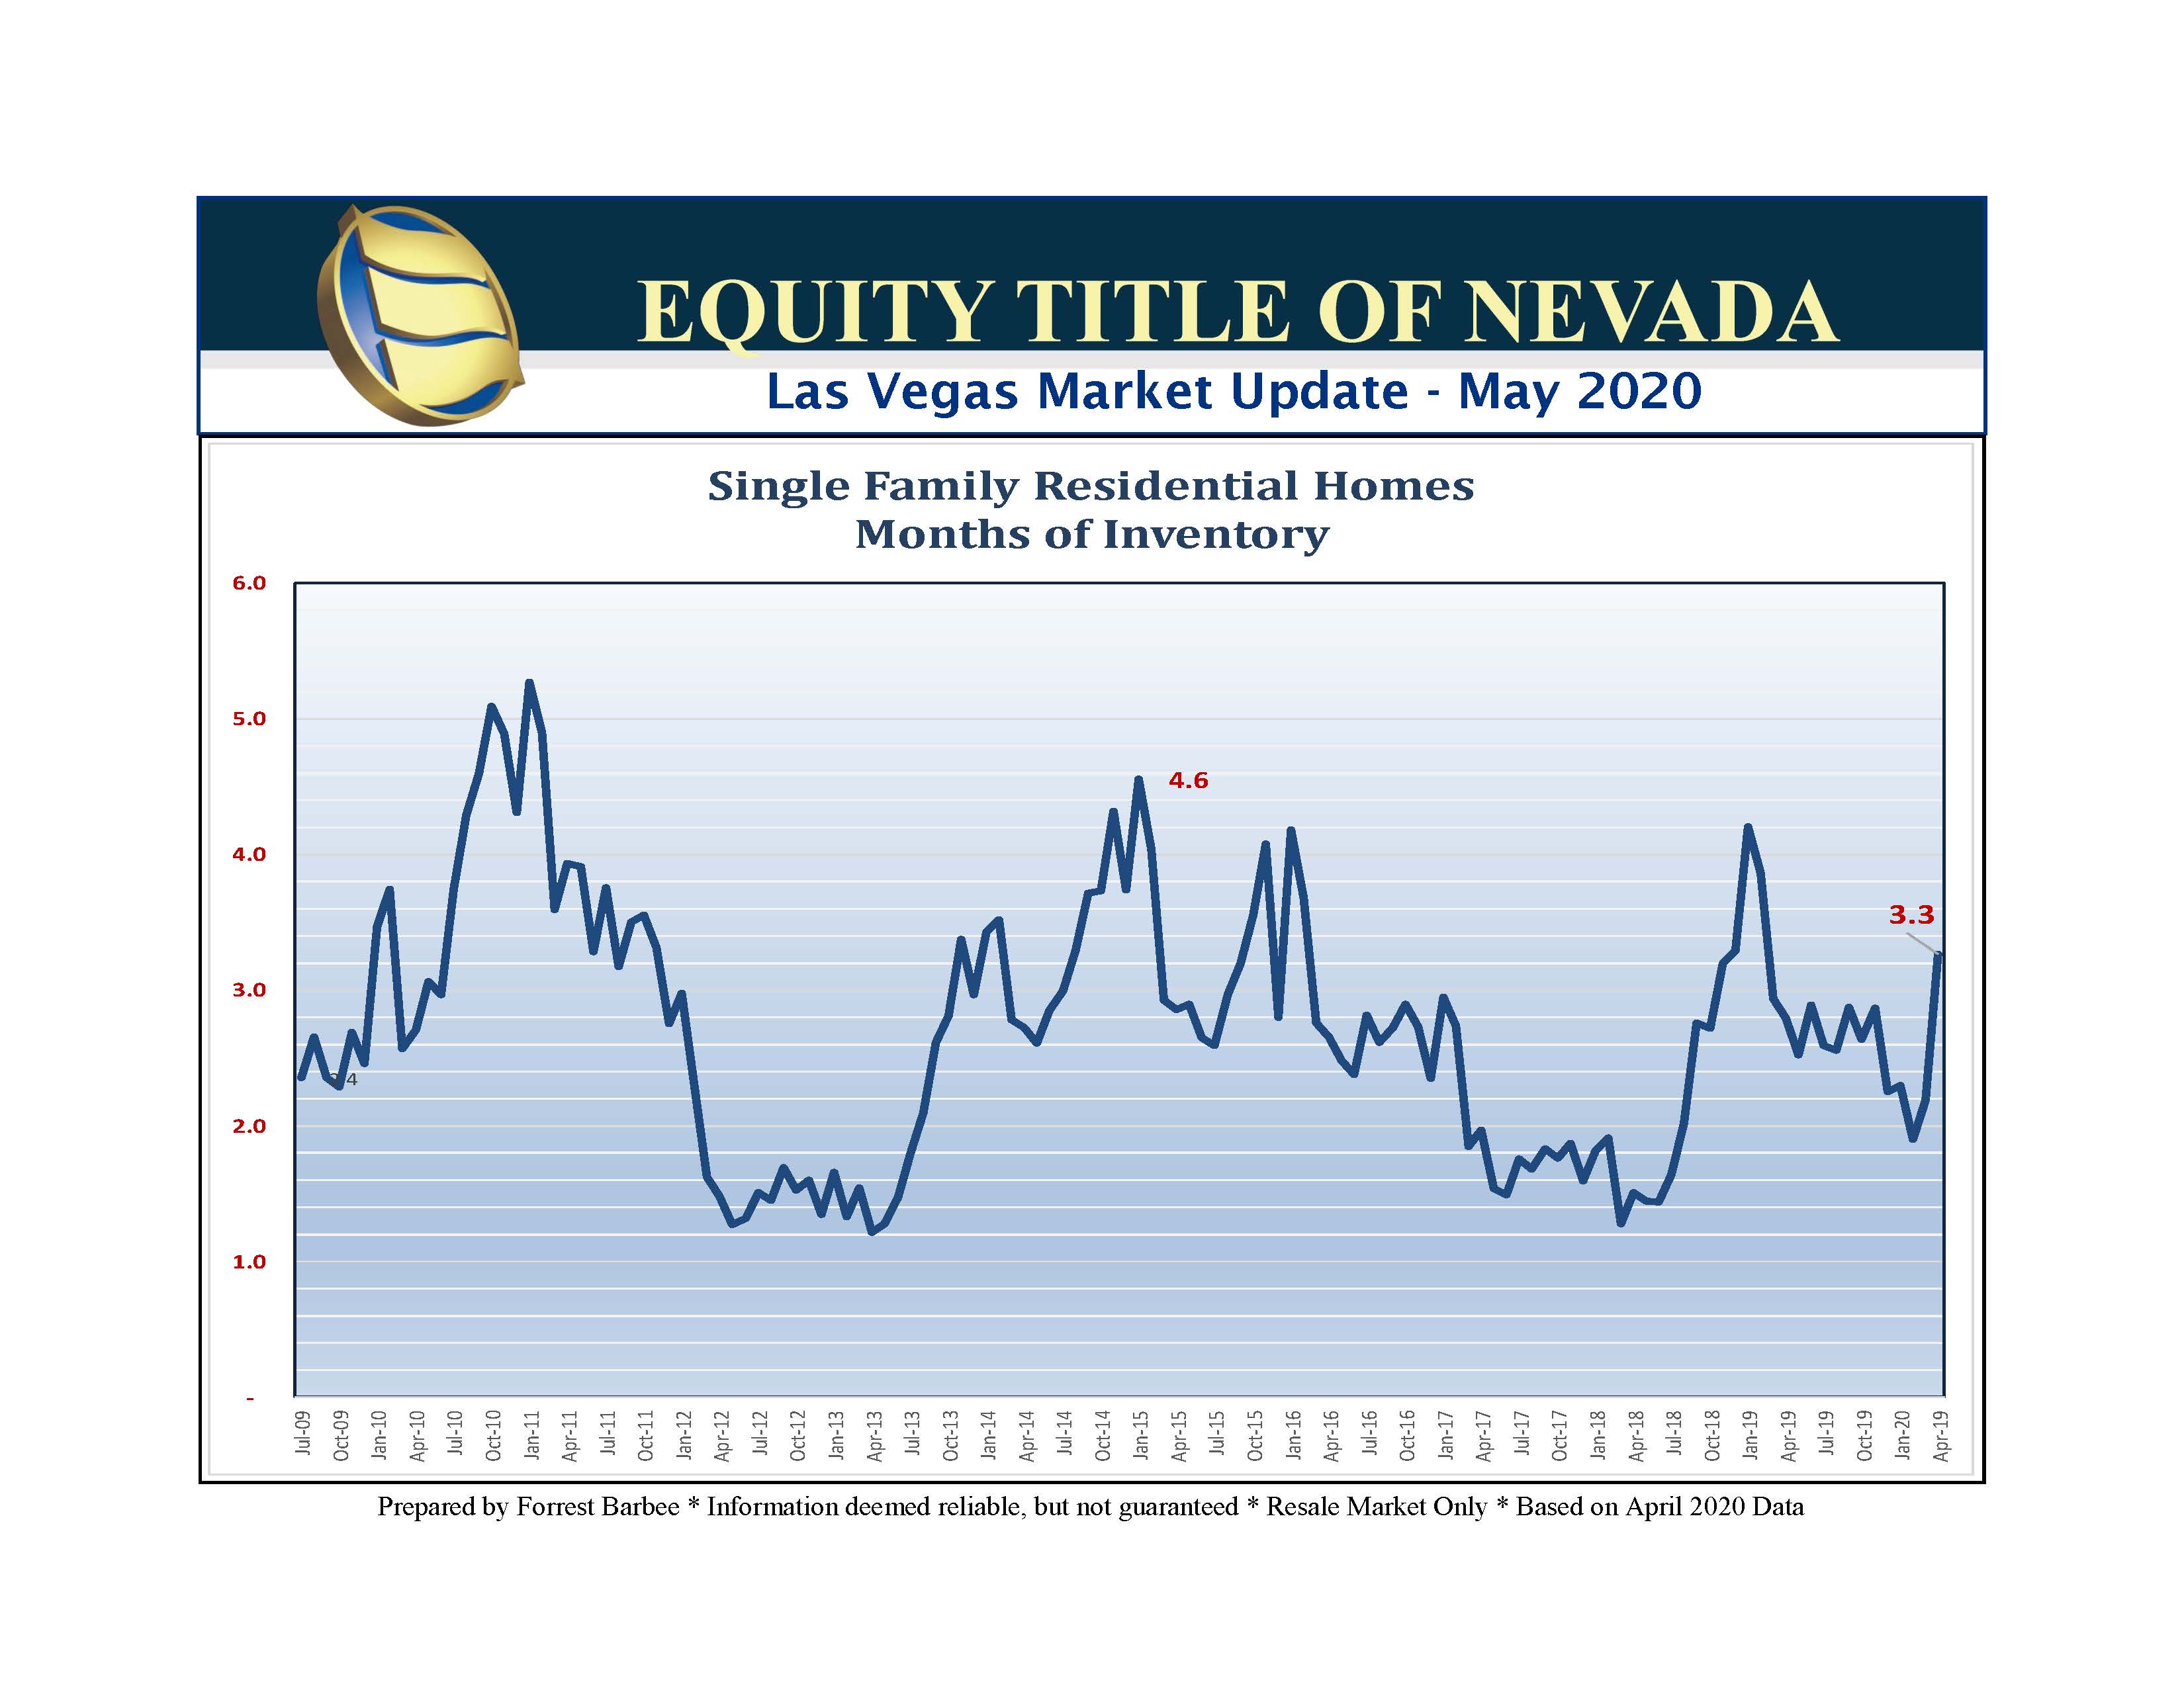
2020 remains 0.8% ahead of 2019 at this juncture – despite the challenging lockdown we endured! Meanwhile, SFR inventory increased to 3.3 months overall based on the market shift of supply and demand, creating an ever wider variance from community to community. But wait . . . there’s really only about one and one-half months of marketable inventory because 54% of all SFR homes are listed at obese prices!
Market Over Pricing
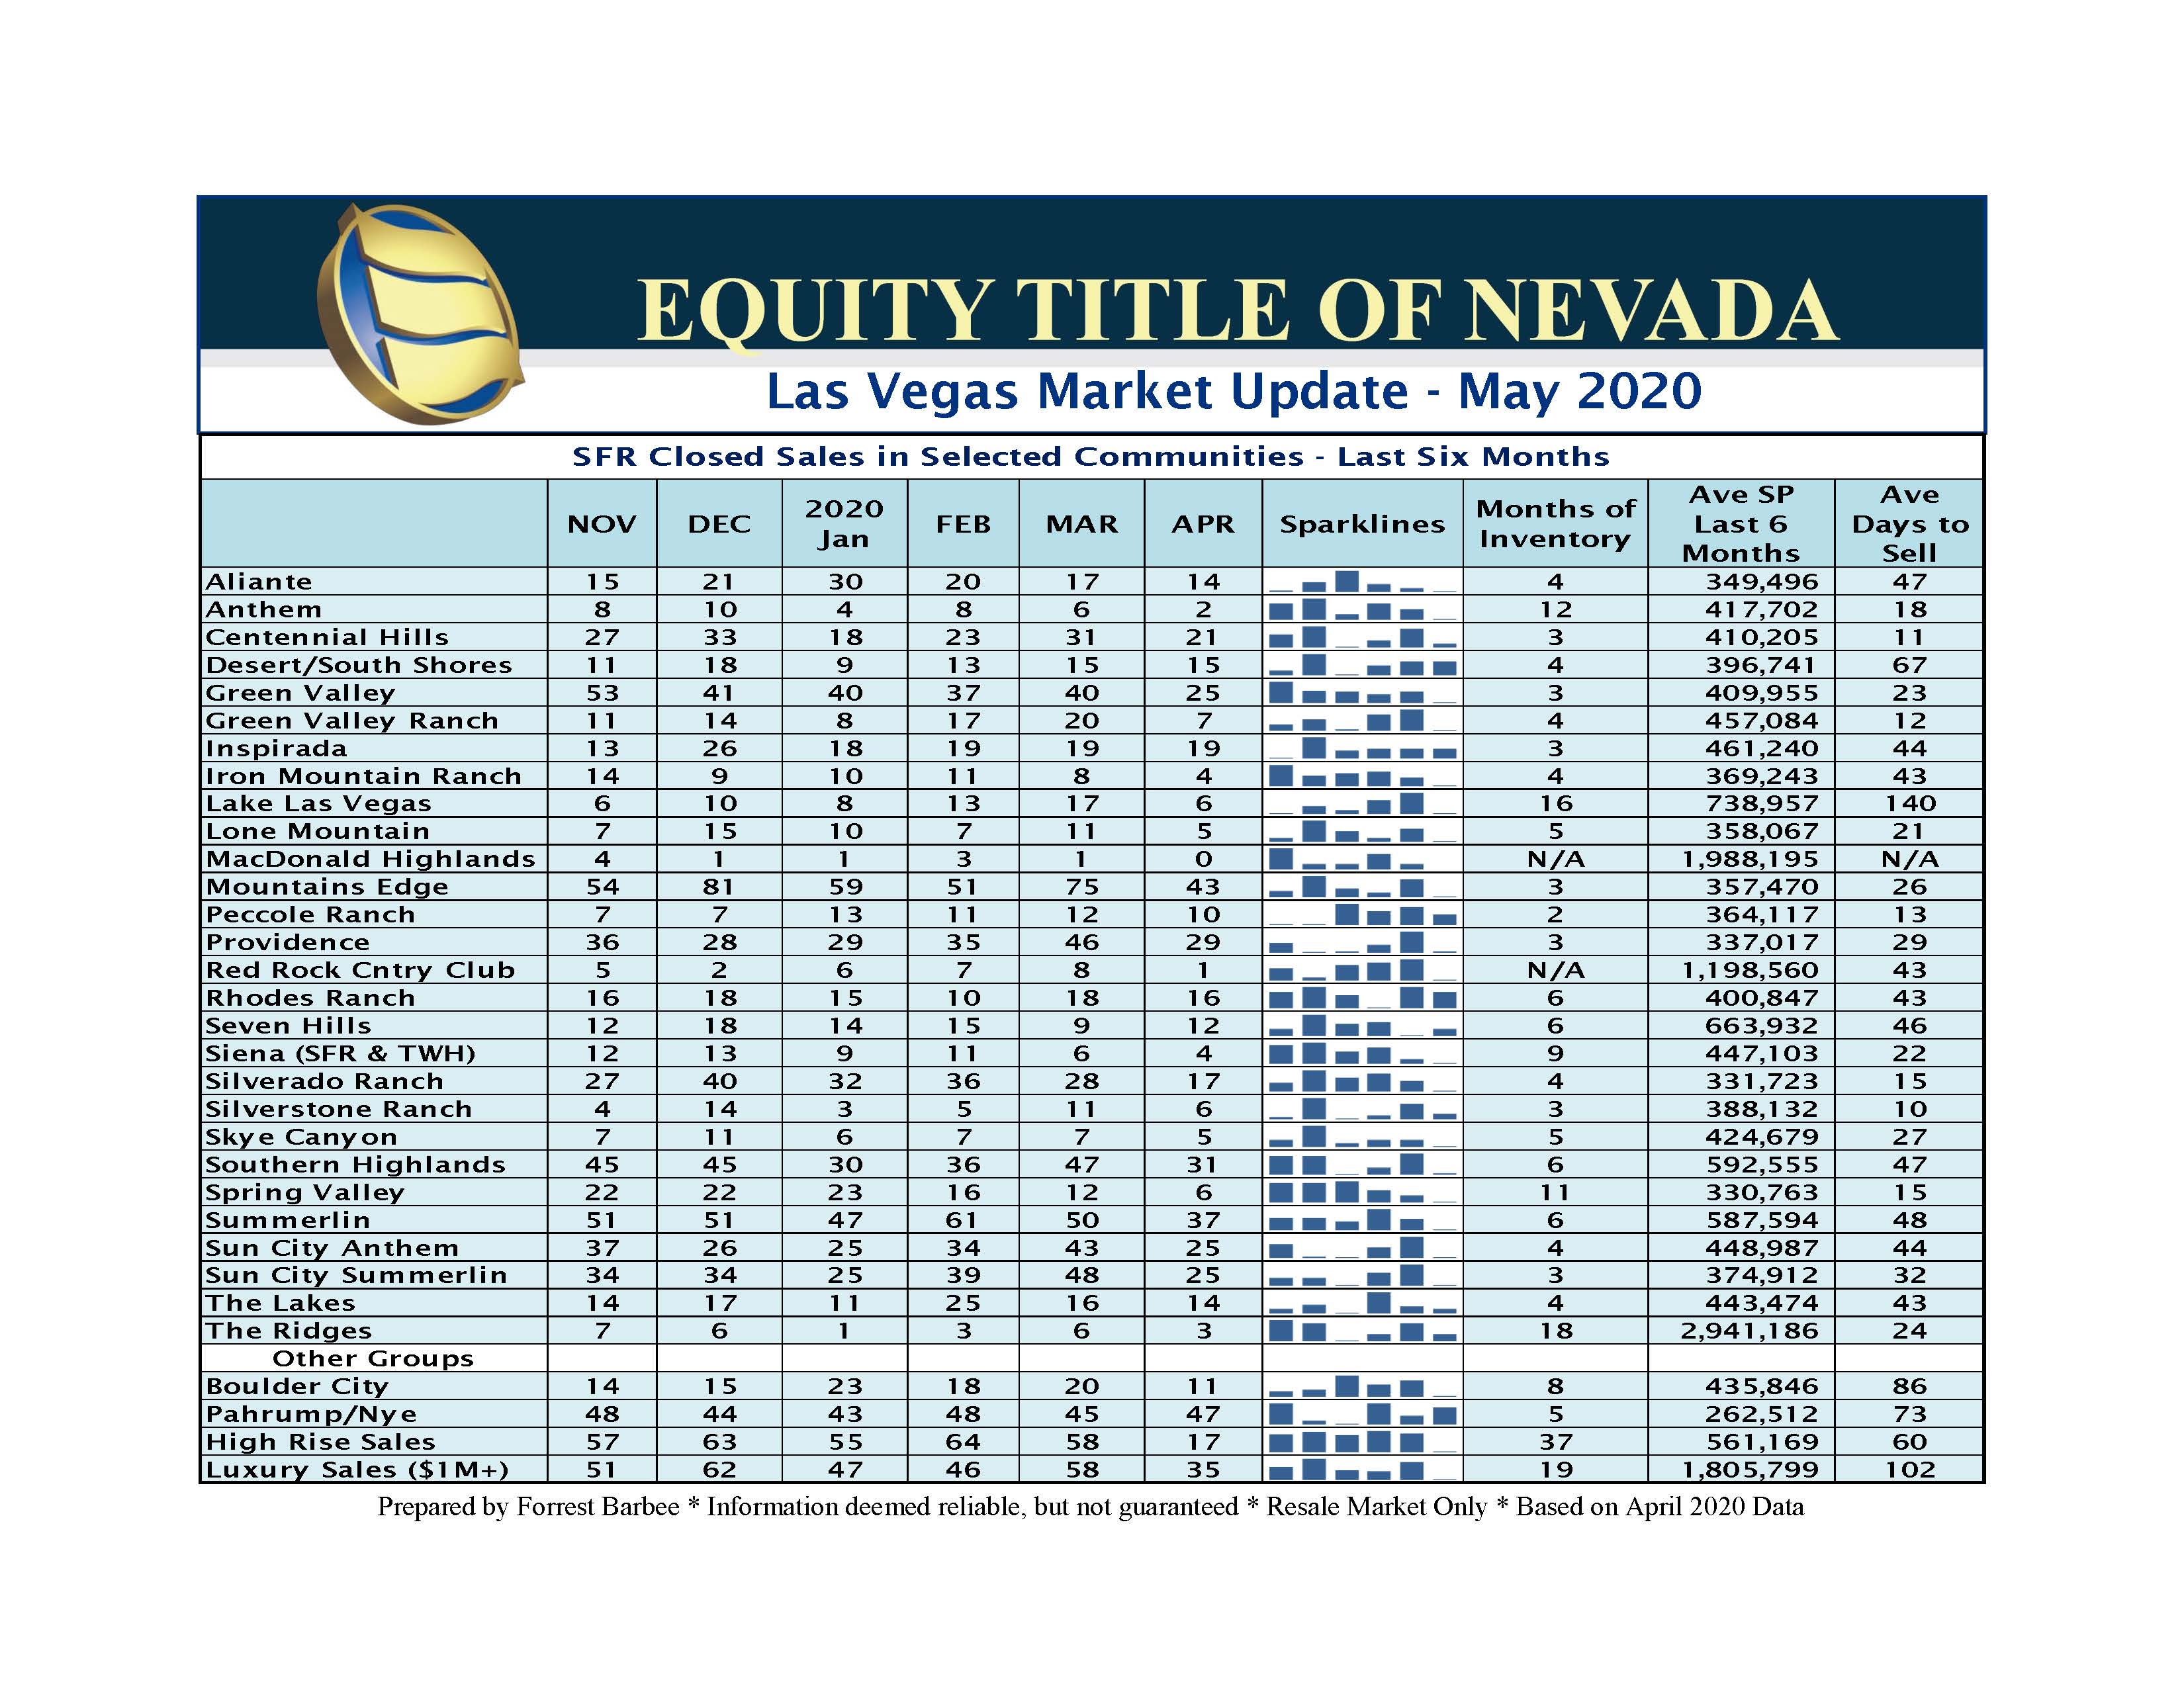
The level of over pricing The SFR Over Pricing Index rose sharply to 54%. Yet the average days from list to close dropped to 38 days in April. So what happened? The older, seasoned, overpriced properties continued to sit without much activity, showings, or offers. Meanwhile, the newer inventory appears to have been priced to the market and went under contract almost as quickly as they come on the market. Note that ten of the communities above experienced 25 days or less to sell! Kudos to those listing agents!! John Joseph would be proud.
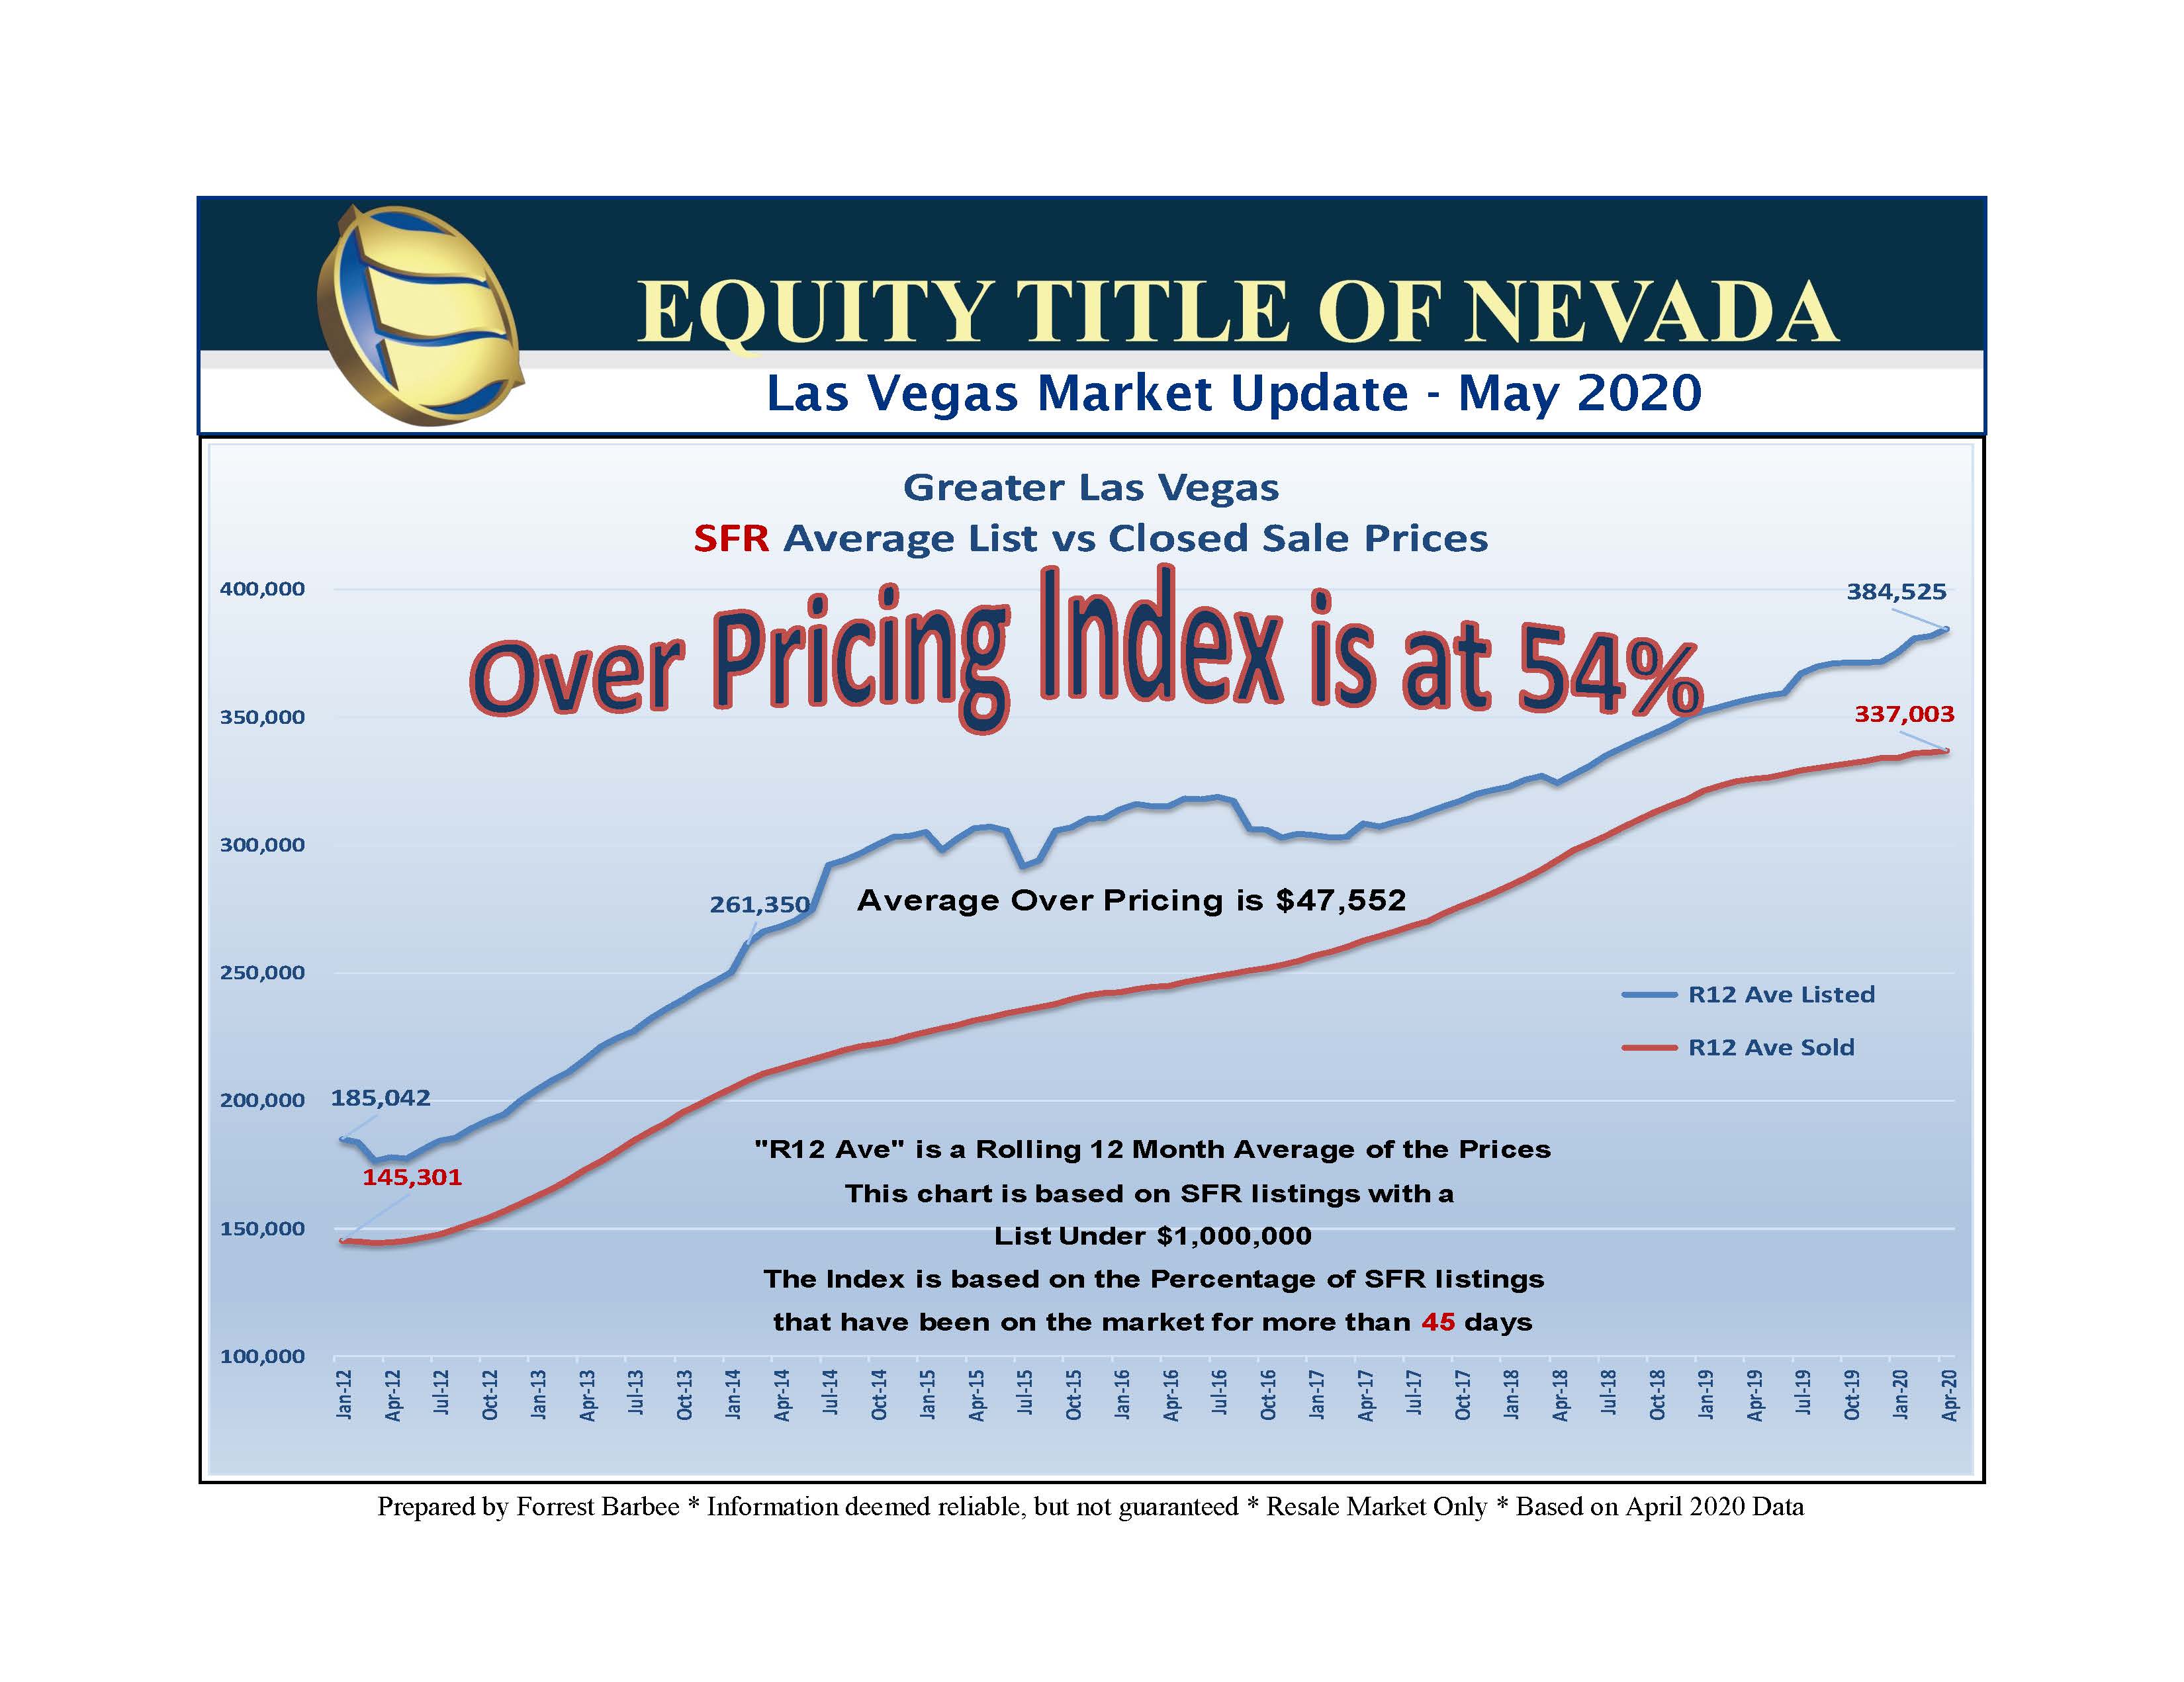
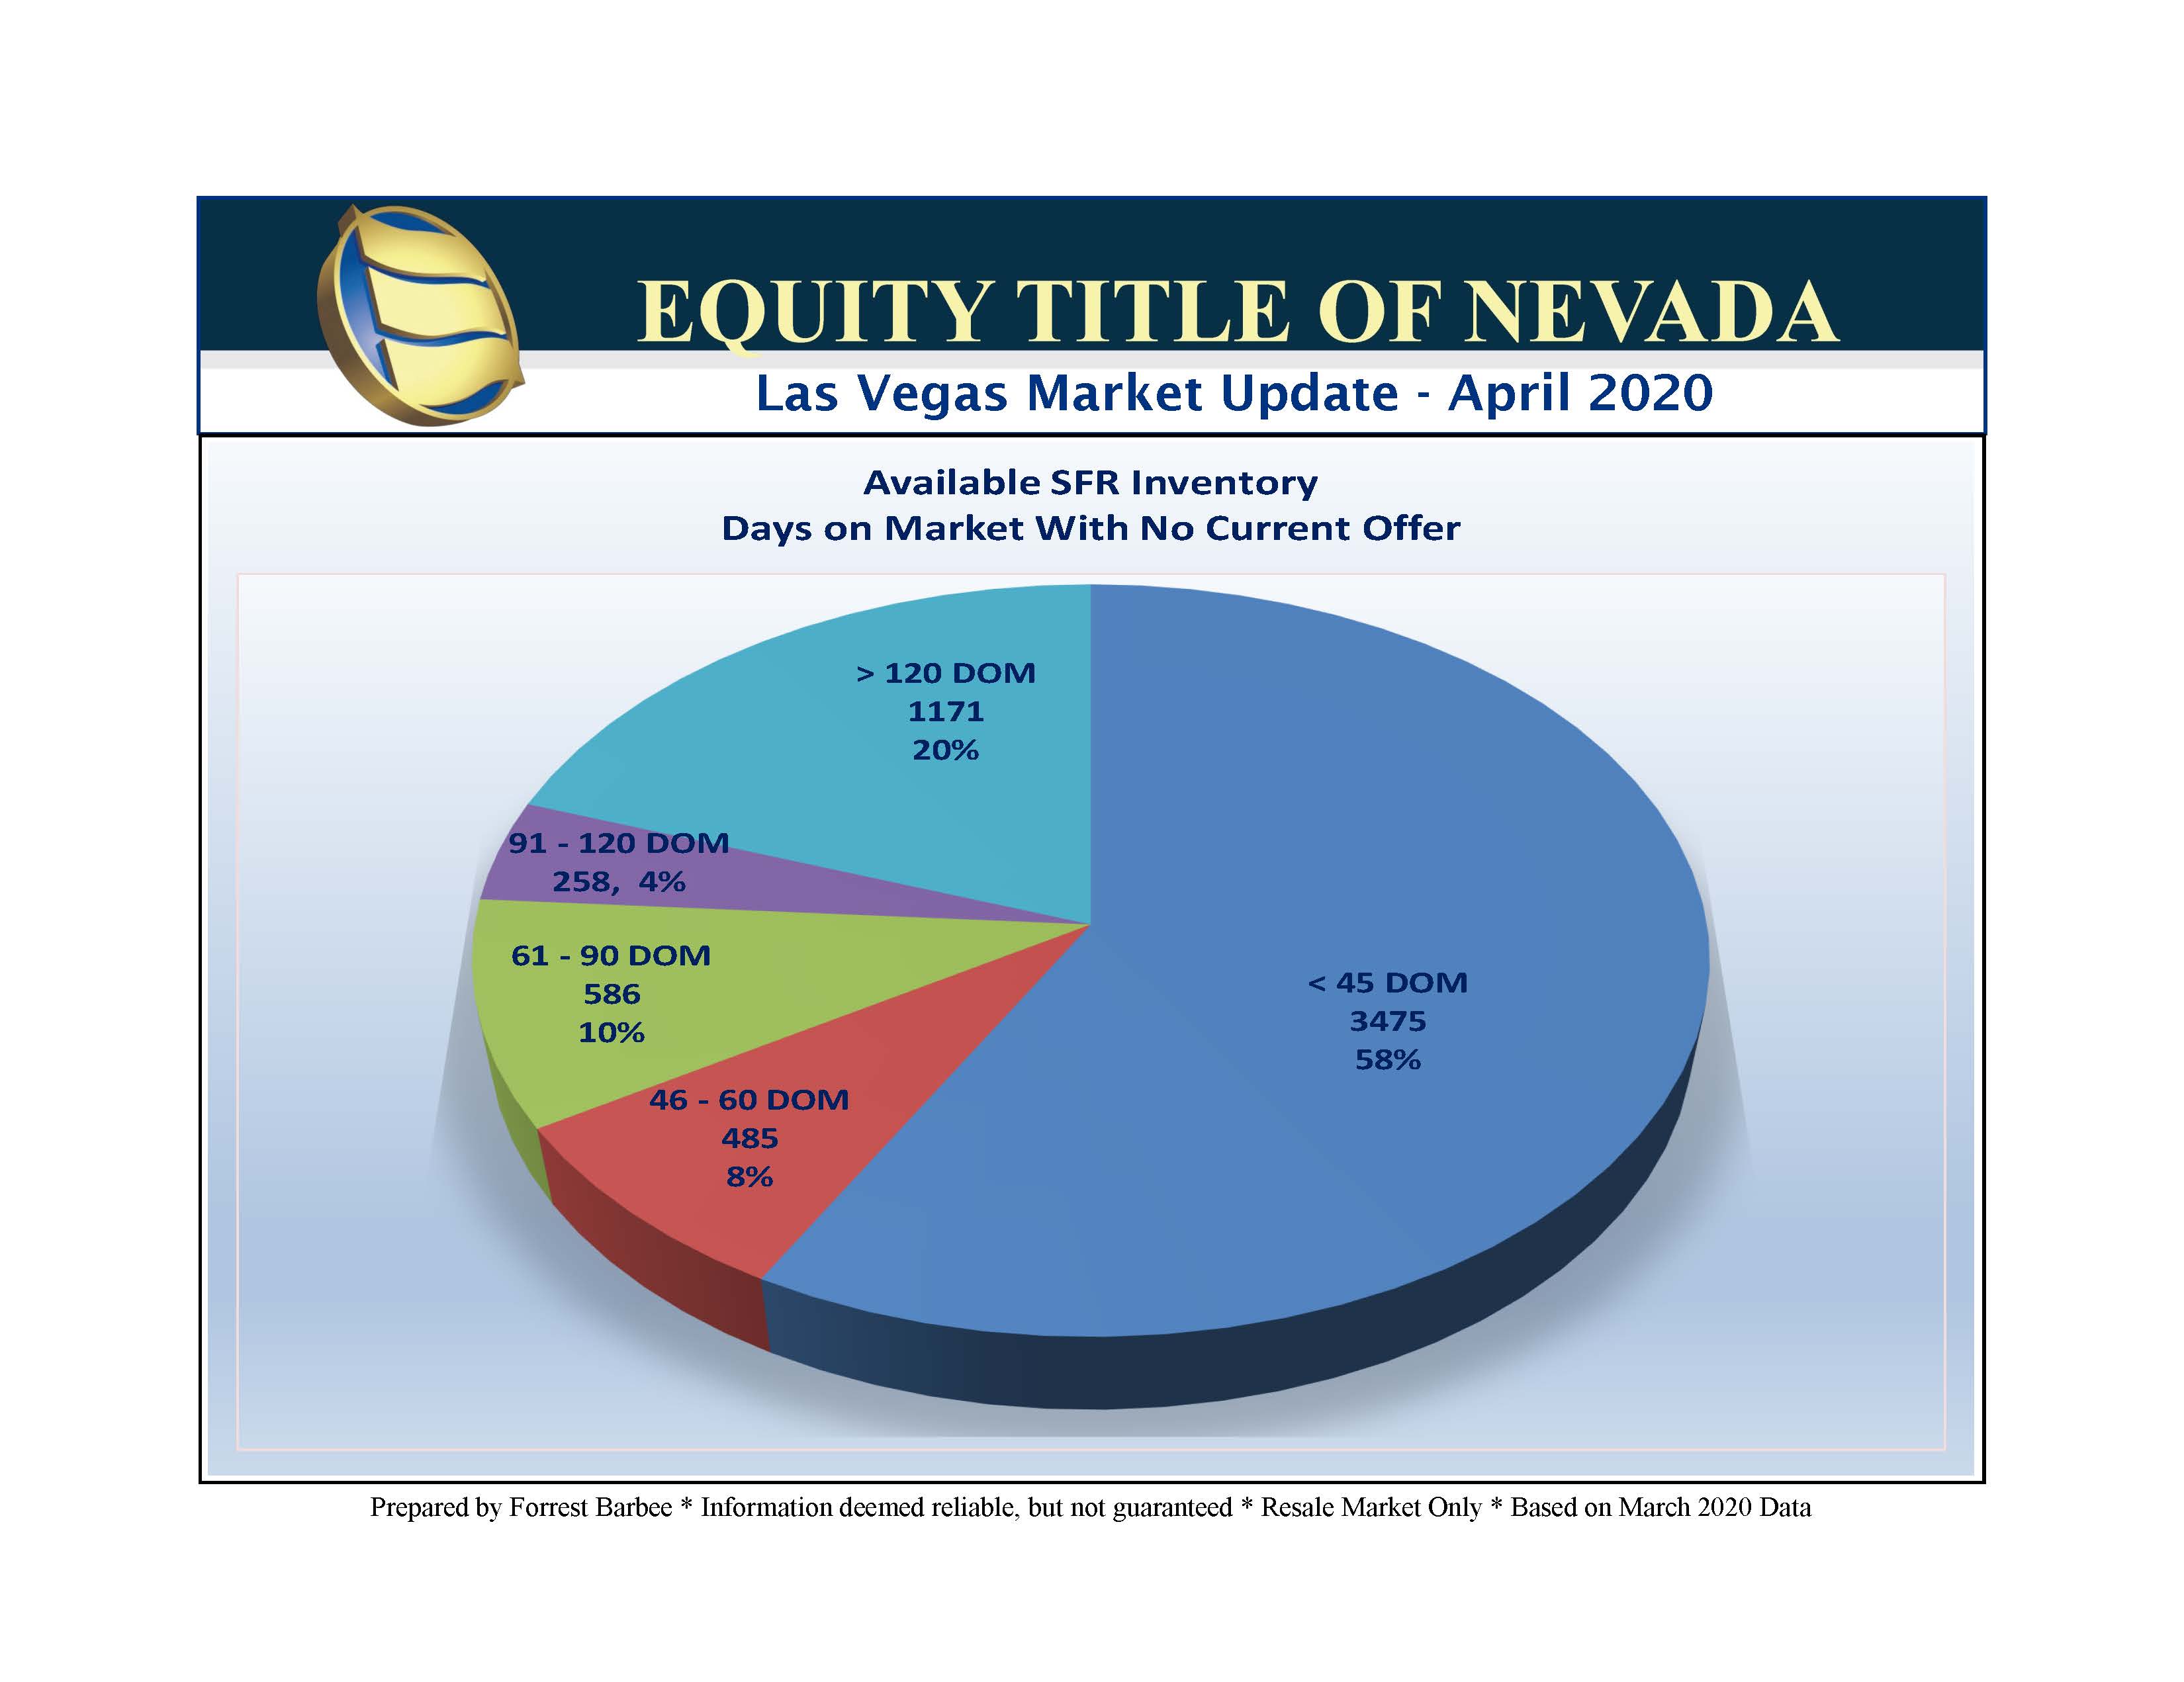
The next two charts show the over pricing quite well and demonstrate that newer listings are winning the day.
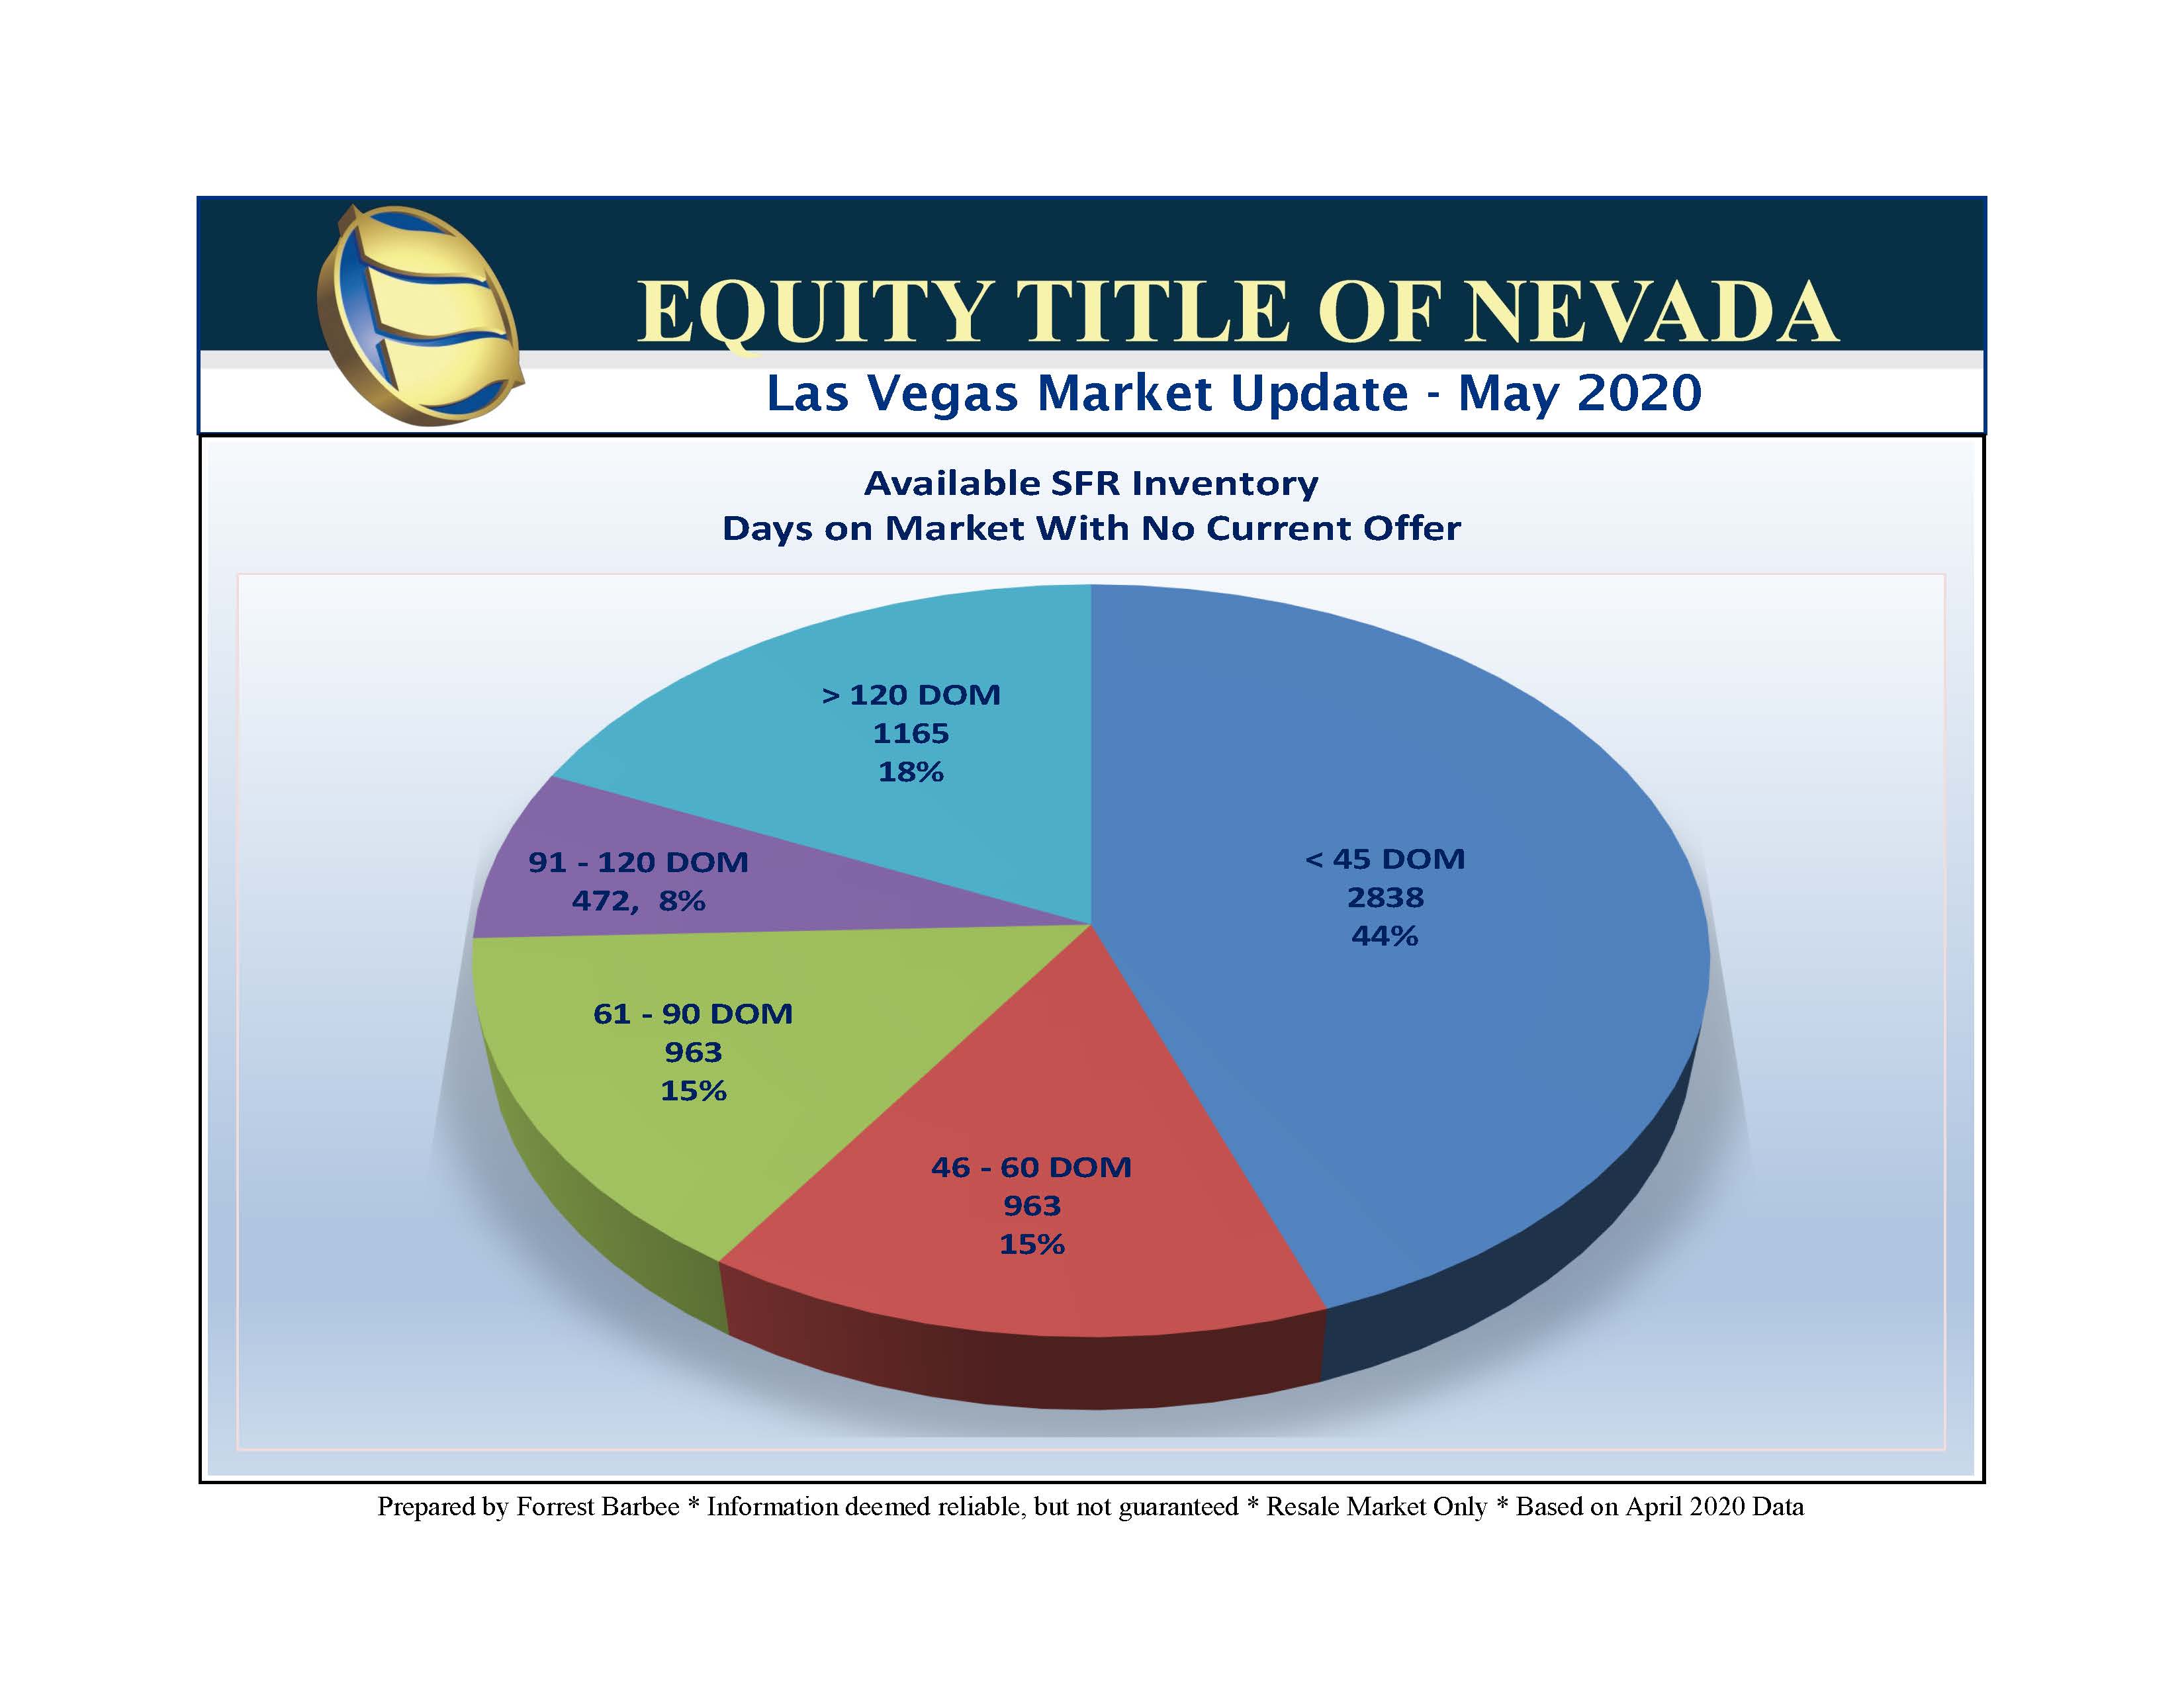
Market Snapshot
There were 3301 residential listings taken in March – 1,417 fewer than in March. The 8,335 available listings at this time is an 8 percent increase from last month, while the 3,289 Pendings reflects a 15% decrease in open escrows. However, the 2,415 residential closings in April is a resounding 30% decrease from previous months closings.
The median closed sales price of an SFR decreased from $319,000 to $310,000 – 2.8% from March 2020. Similarly, the average closed sales price of an SFR went from $371,942 to $361,326 – a 2.9% decrease. Cash continued to dry up this past month, complicating the buying process somewhat at the higher market price points. Less cash for luxury market sales potentially means more demand for jumbo loans – and those have been quite a challenge.
