Current Las Vegas Market Individual Charts
Current Las Vegas Market Report
Market Overview
The first two months of 2022 lag January and February 2021 by 2.7%. Available inventory and listings taken in February were roughly the same as January – leaving the SFR market with 0.9 months of available inventory. The average days on market fell to 24 days.
The median sales price of SFR closings jumped once again from $435,000 to $450,000 for a one-month gain of 3.5% while the SFR average closed sales price reached $534,055 for a one-month increase of 1.24%. Let’s discuss average versus median price movement. The average prices have slowed down while the median price continues to rise sharply. What’s causing this? Well, it is a combination of a significantly larger number of sales at the higher price points while concurrently the lower end of the market experiences contraction or shrinkage of closed units – especially below $300,000.
We are keenly aware of the upward price pressures in this market with continued scarce supply and a consistent, if not robust demand. Perhaps a bubble? Not at all! The market forces that caused the bubble that burst in 2006 do not exist today. Moreover, Las Vegas enjoys a much more diversified economy and wider range of businesses than ever before in Las Vegas history. We are no longer a “one trick pony” dependent solely upon gaming despite gaming and conventions remaining the bedrock or foundation that this economy is built upon. We enjoy a sustainable growth market as we begin leaving the pandemic behind us!
Challenges in the Price Range Below $300,000

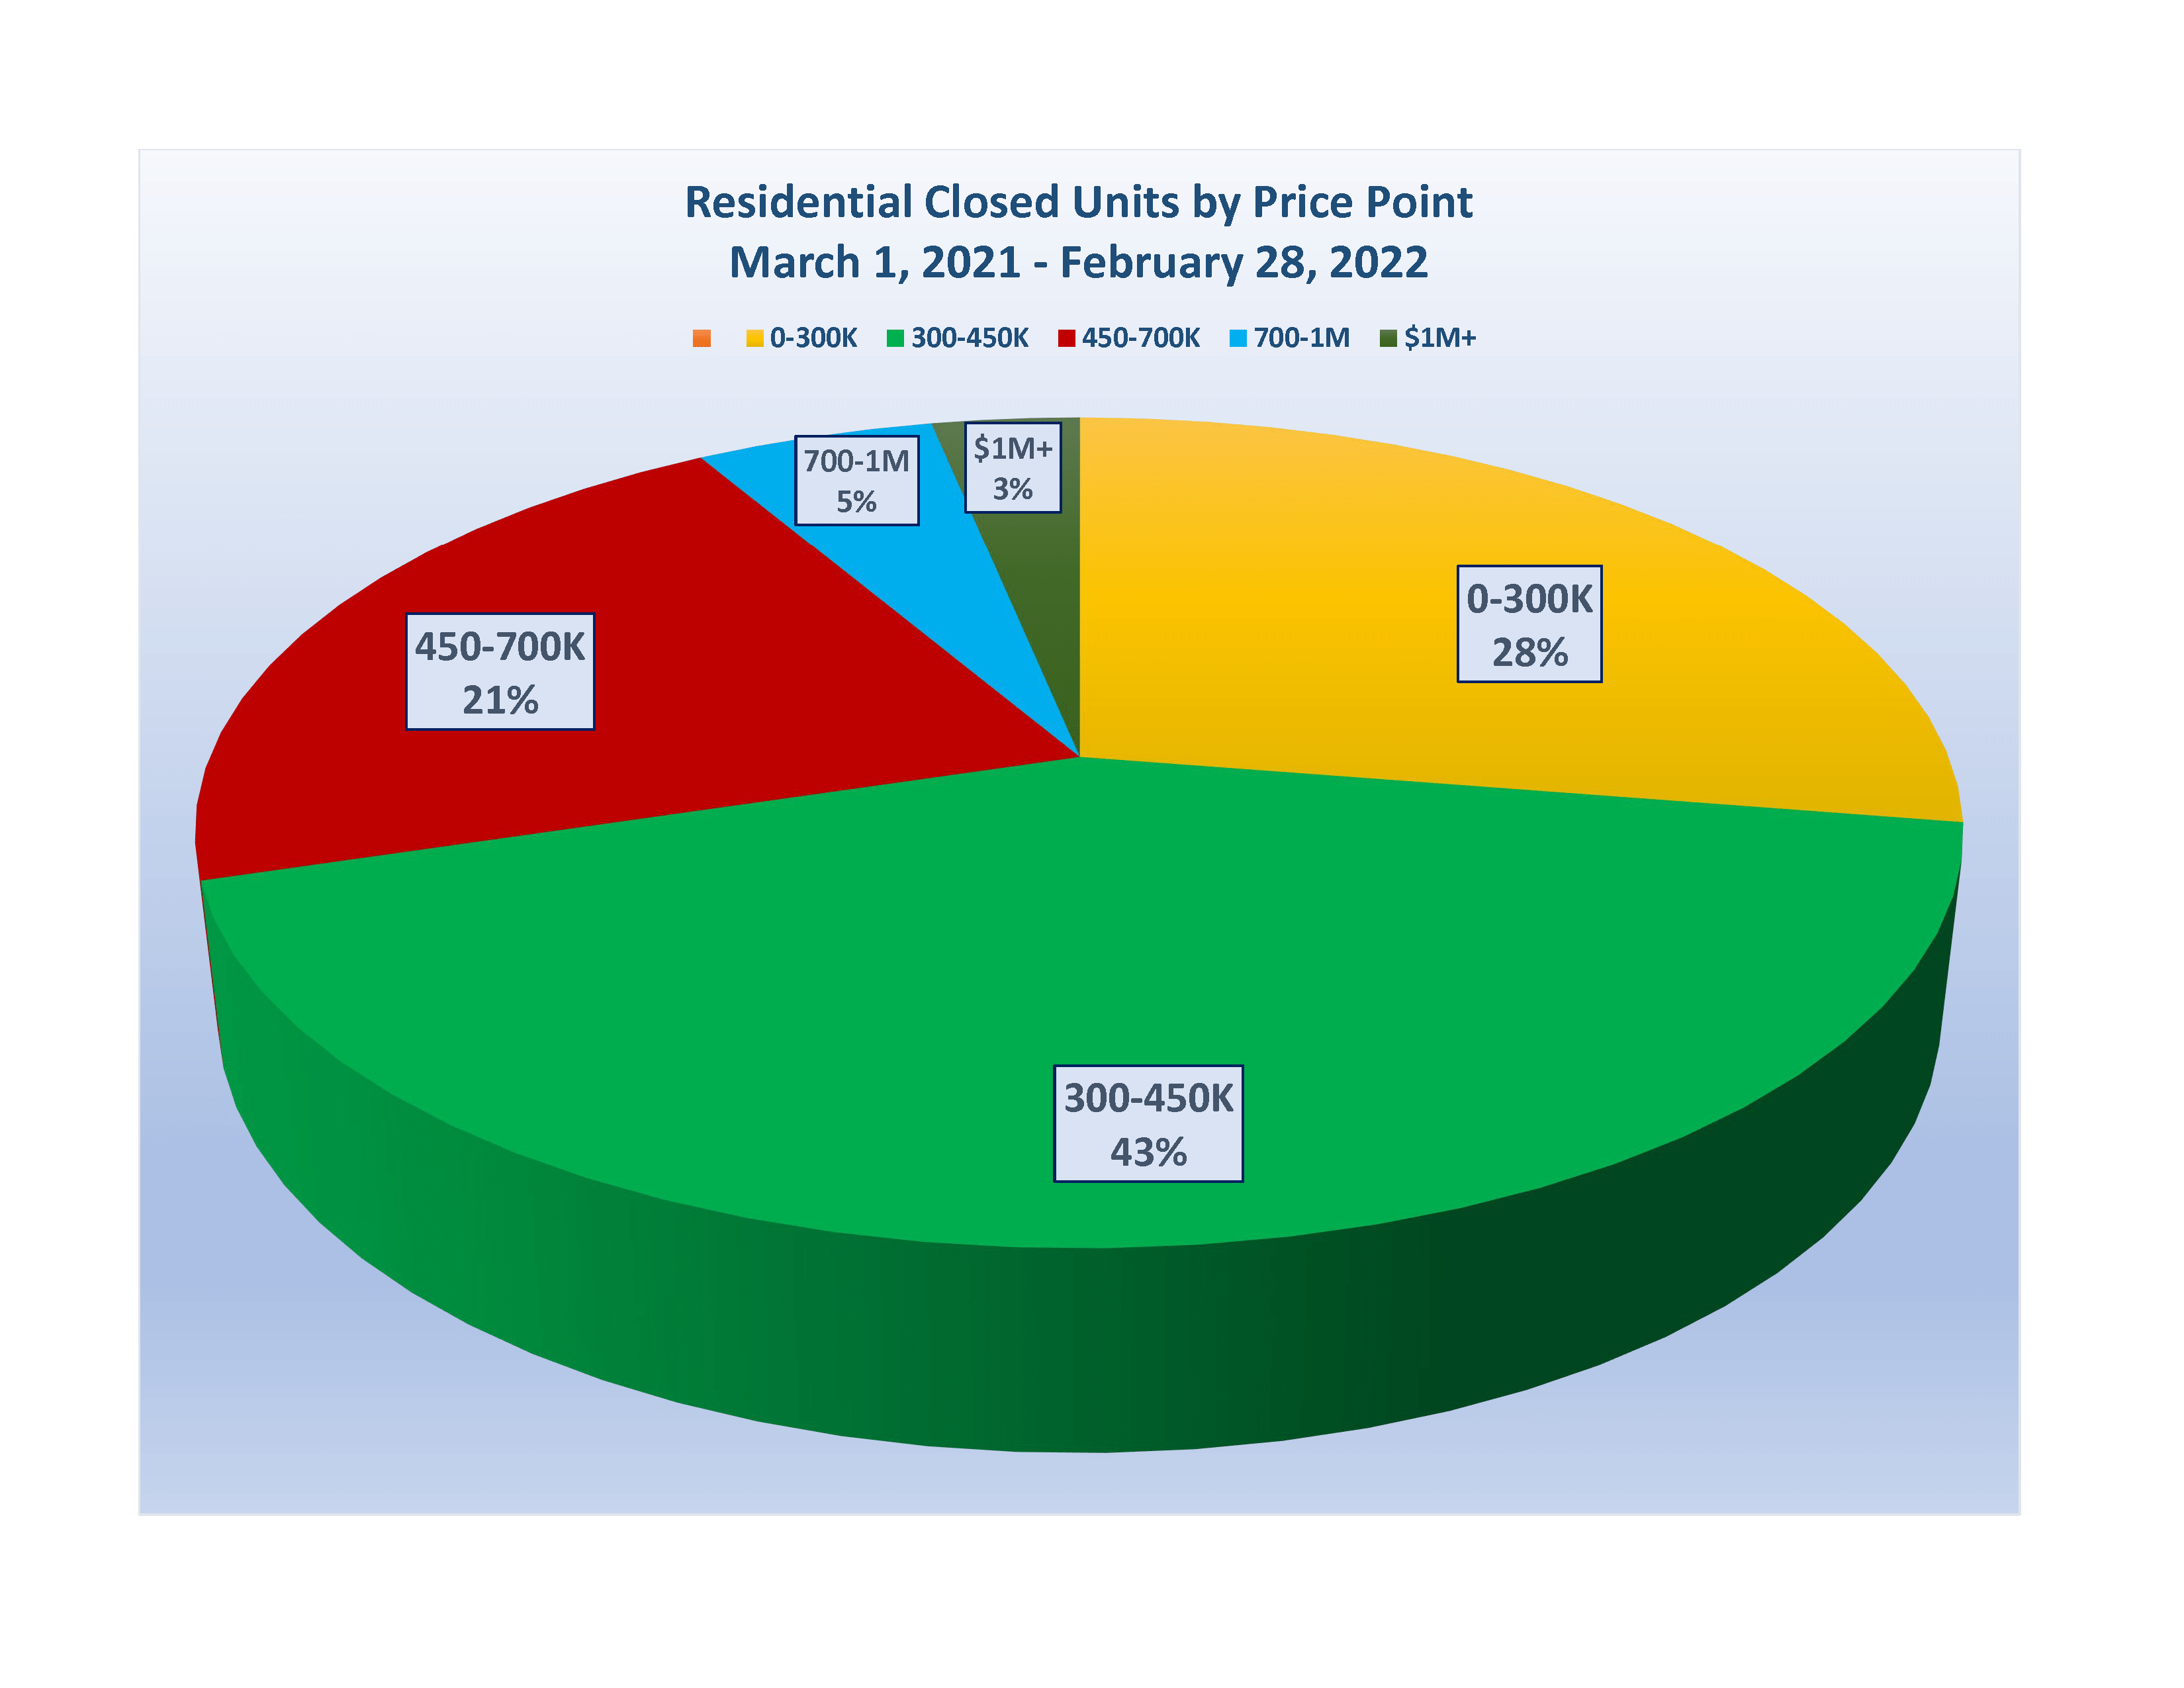
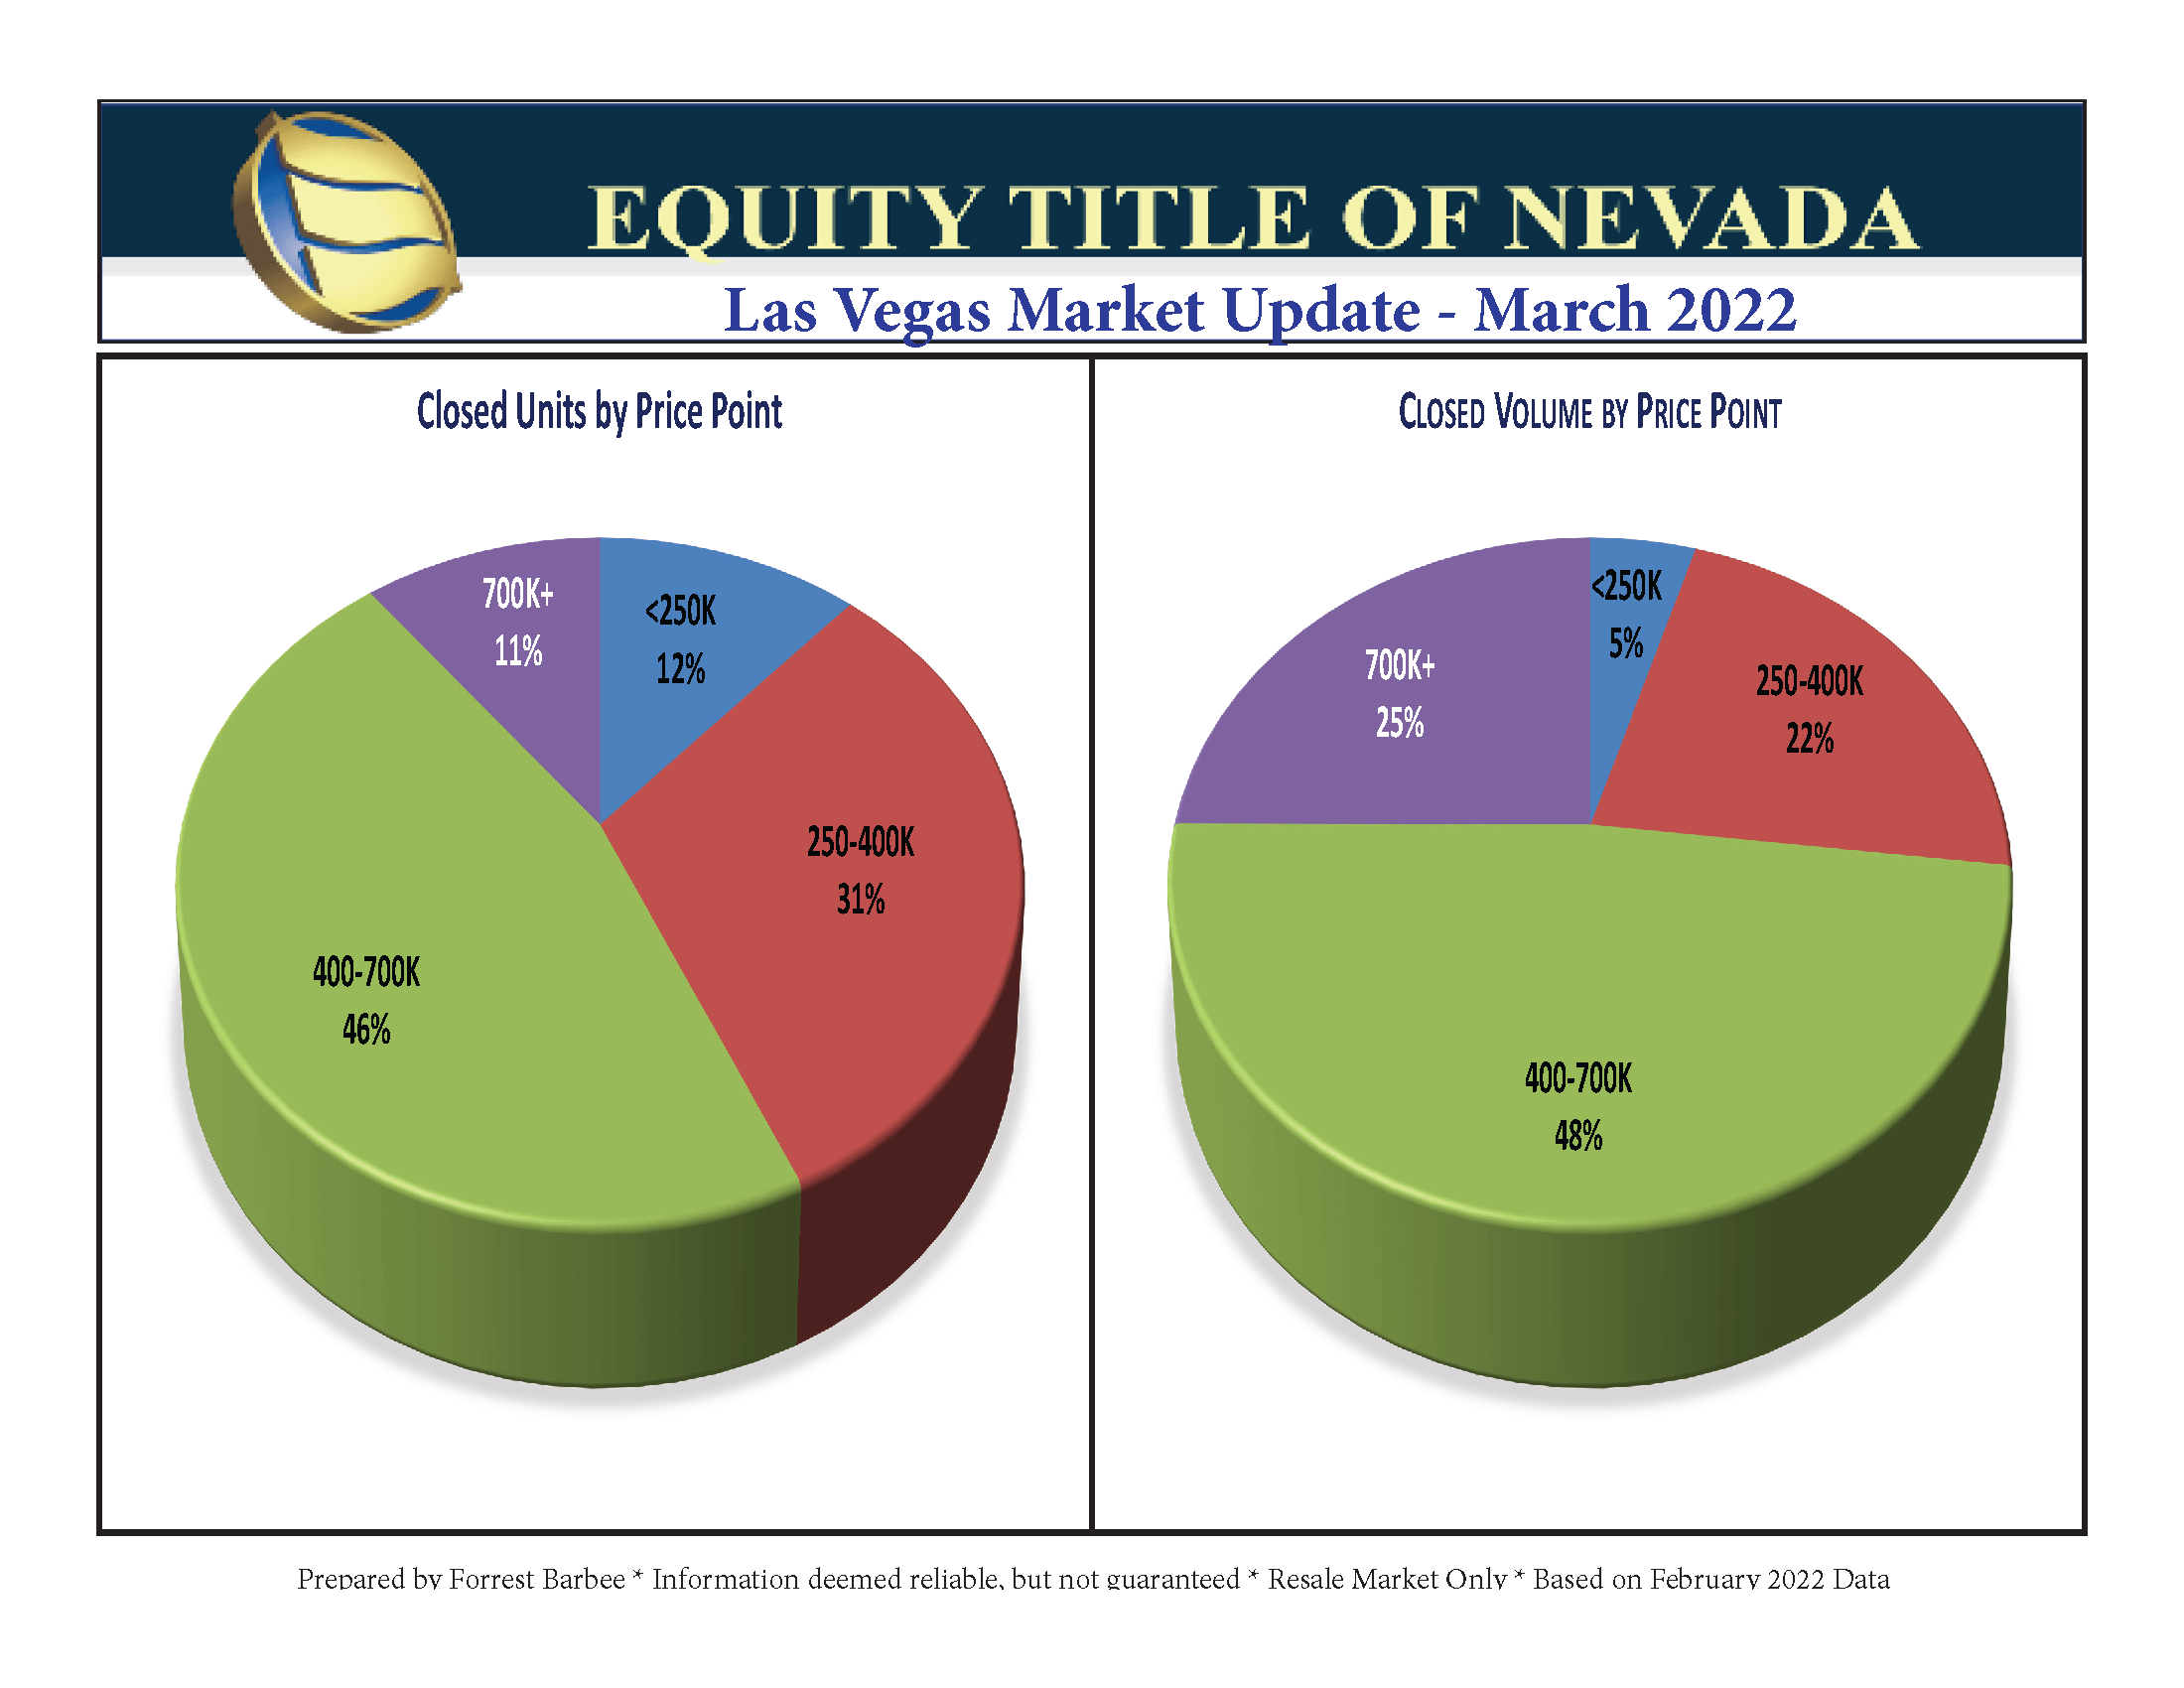
For the previous twelve-month period ending February 2021: 46% of all closings were under $300,000. (See Chart Above) However, only 28% of all residential closings were below $300,000. (See Chart Below) That represents an 18% drop or shrinkage in market share for residential closings in that price range. The chart below illustrates those residential closings above $700,000 made up 8% of the total closings for the last twelve months. However, the second chart below (February 2022 closings) show that currently 11% of the total residential closings are above $700,000. It will be interesting to revisit this same chart next year – or even at the end of this year!
These charts are a bit different than my usual charts as the price ranges have been adjusted to show how much demand – in the face of short supply – is quickly eroding the lower price points in this market. Even new attached residential new homes are running in the mid-$300K range. Besides new homes are pulling permits and building inventory as quickly as possible, but are still faced with ongoing lumber, materials, and labor issues.
Property Management Permit Pre-Licensing Class
24 Hour Online Format

New Online Continuing Education Class – Broker Management

