Current Las Vegas Market Individual Charts
Current Las Vegas Market Report
Market Overview
2022 closings are now 17.5% off the 2021 pace but continues to track closely to the 2019 market; closings at this pace could easily end up at 32,000 – 35,000 by the end of the year. Available SFR inventory improved from 7895 units to 8529 units while listings taken in August were nearly 500 less than in July. The SFR market sits right at 5 months of available inventory even as the condo and townhome segment rose to 4 months of inventory. The average days on market increased to 24 days. This metric should be rising but so many “older” listings are constantly being relisted to create the impression that the listing is new by reflecting fewer days on the market. No one is fooled by this any longer.
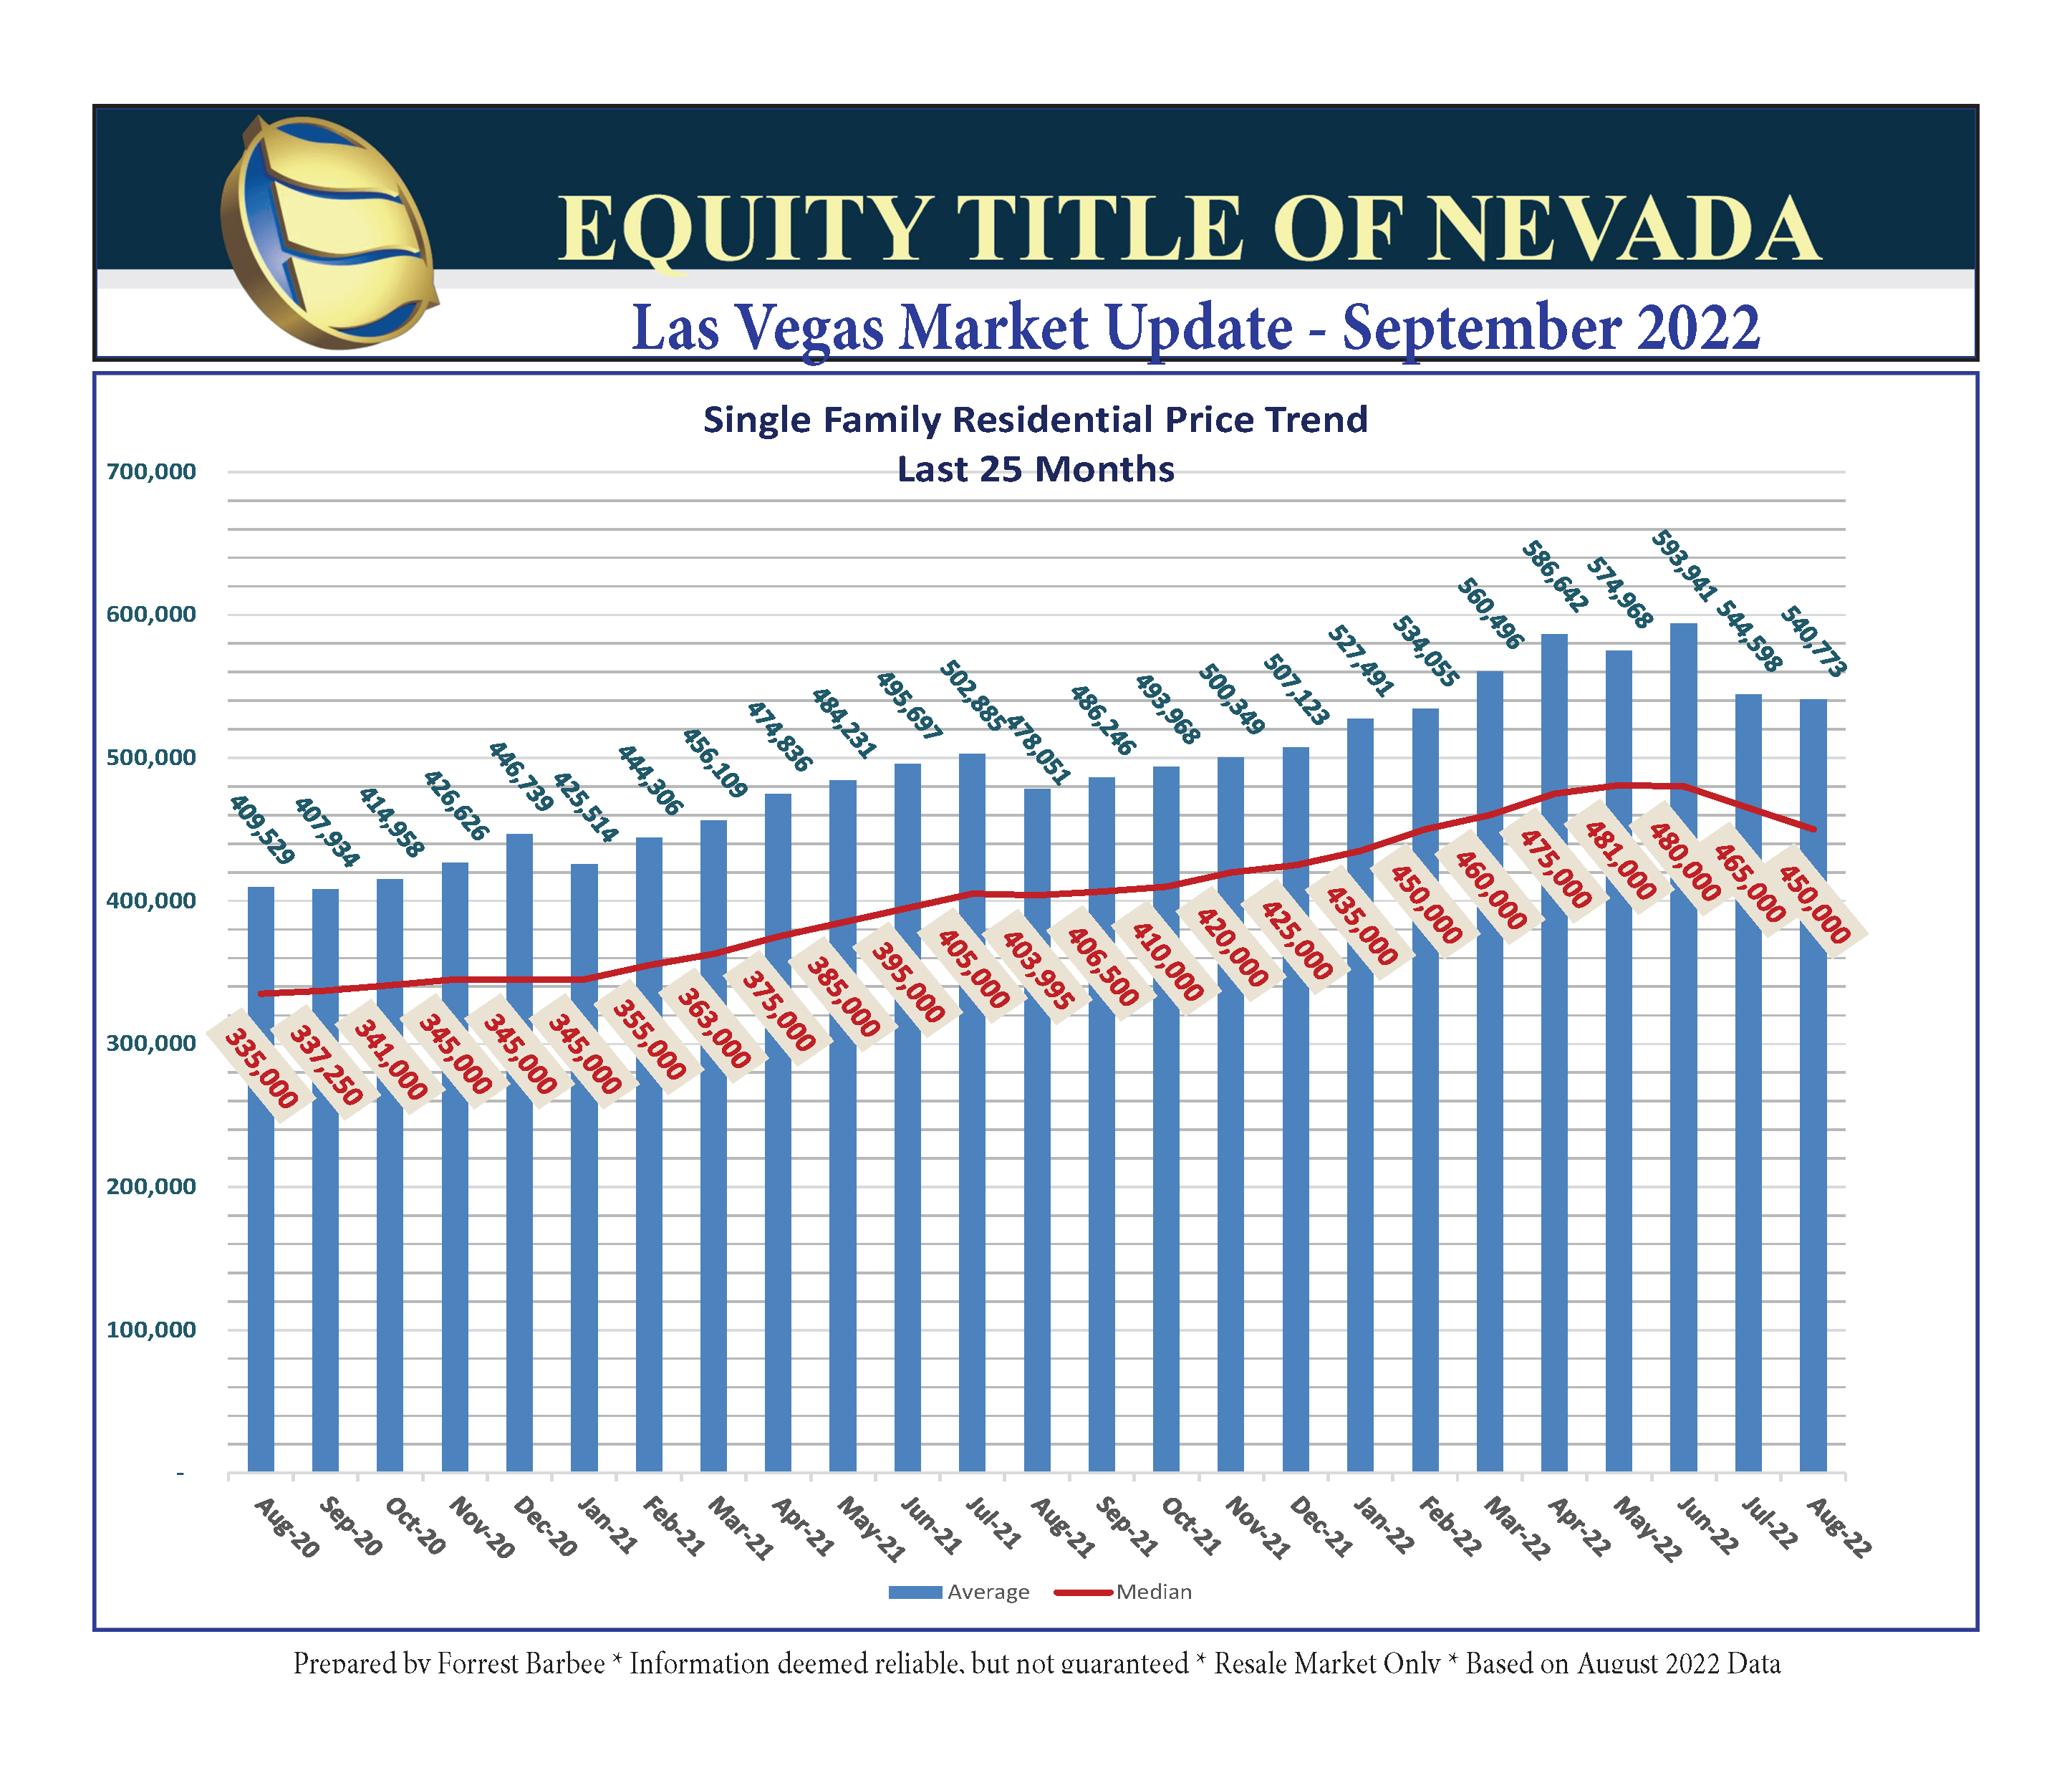
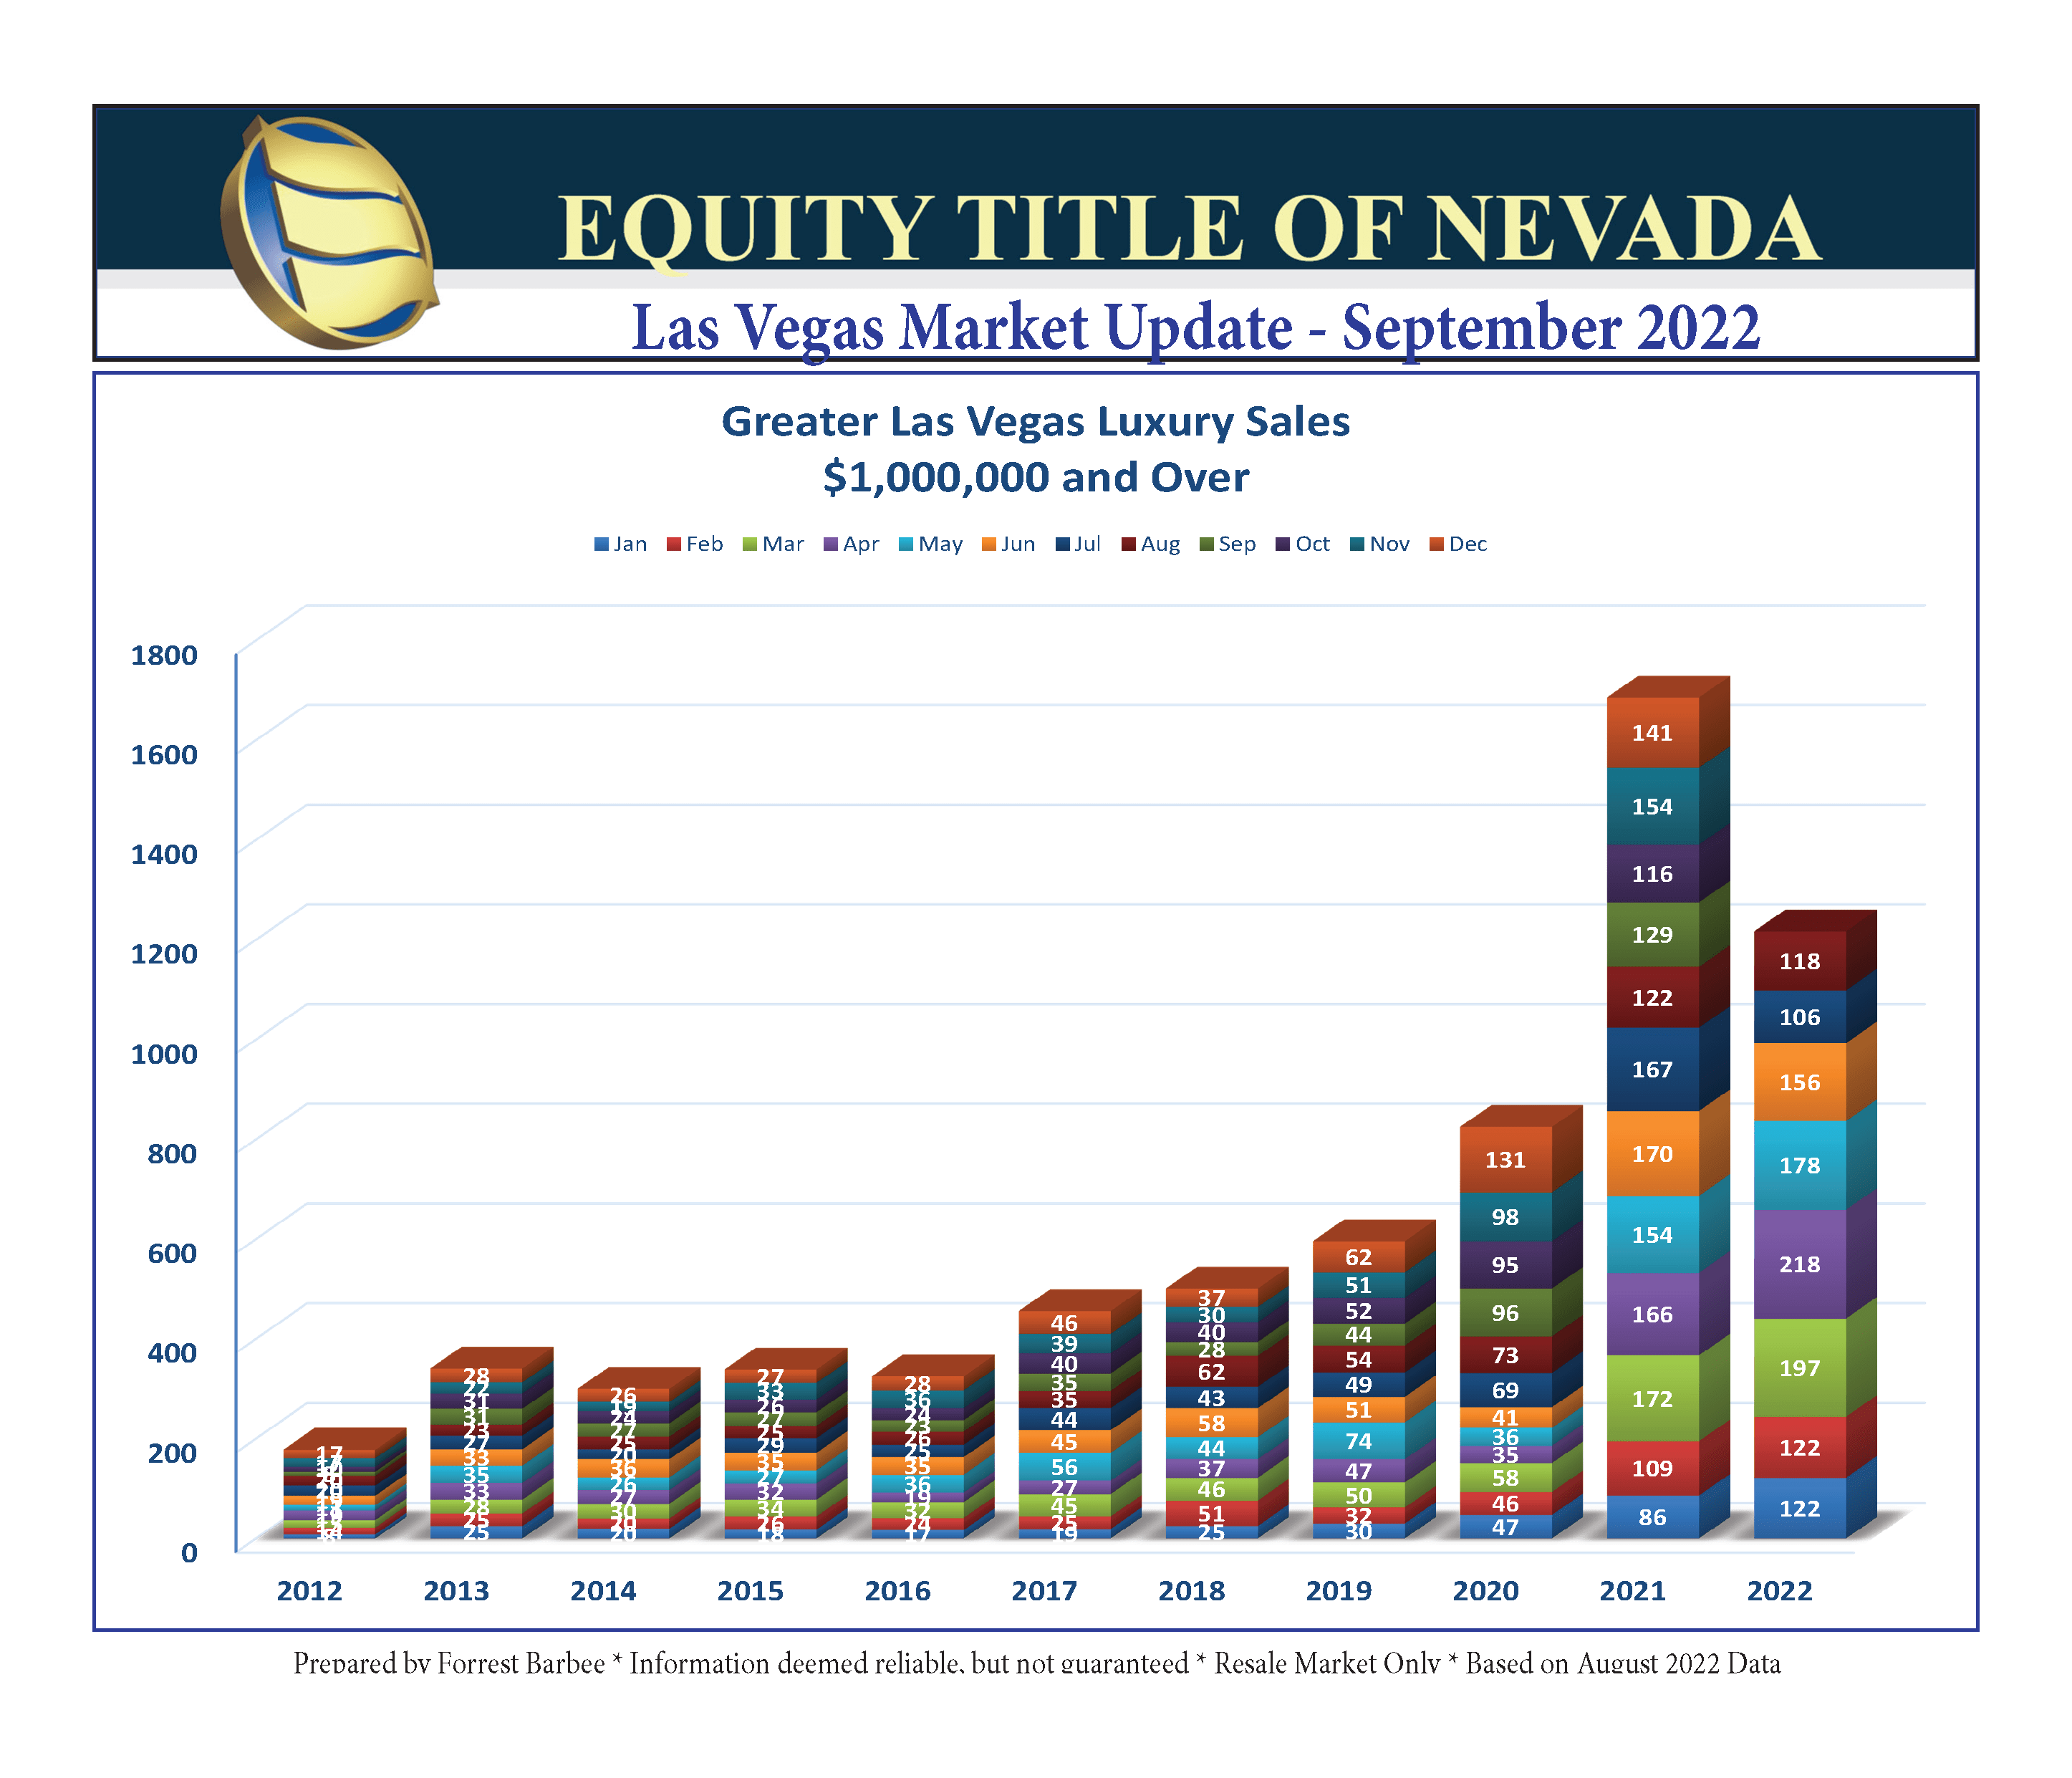
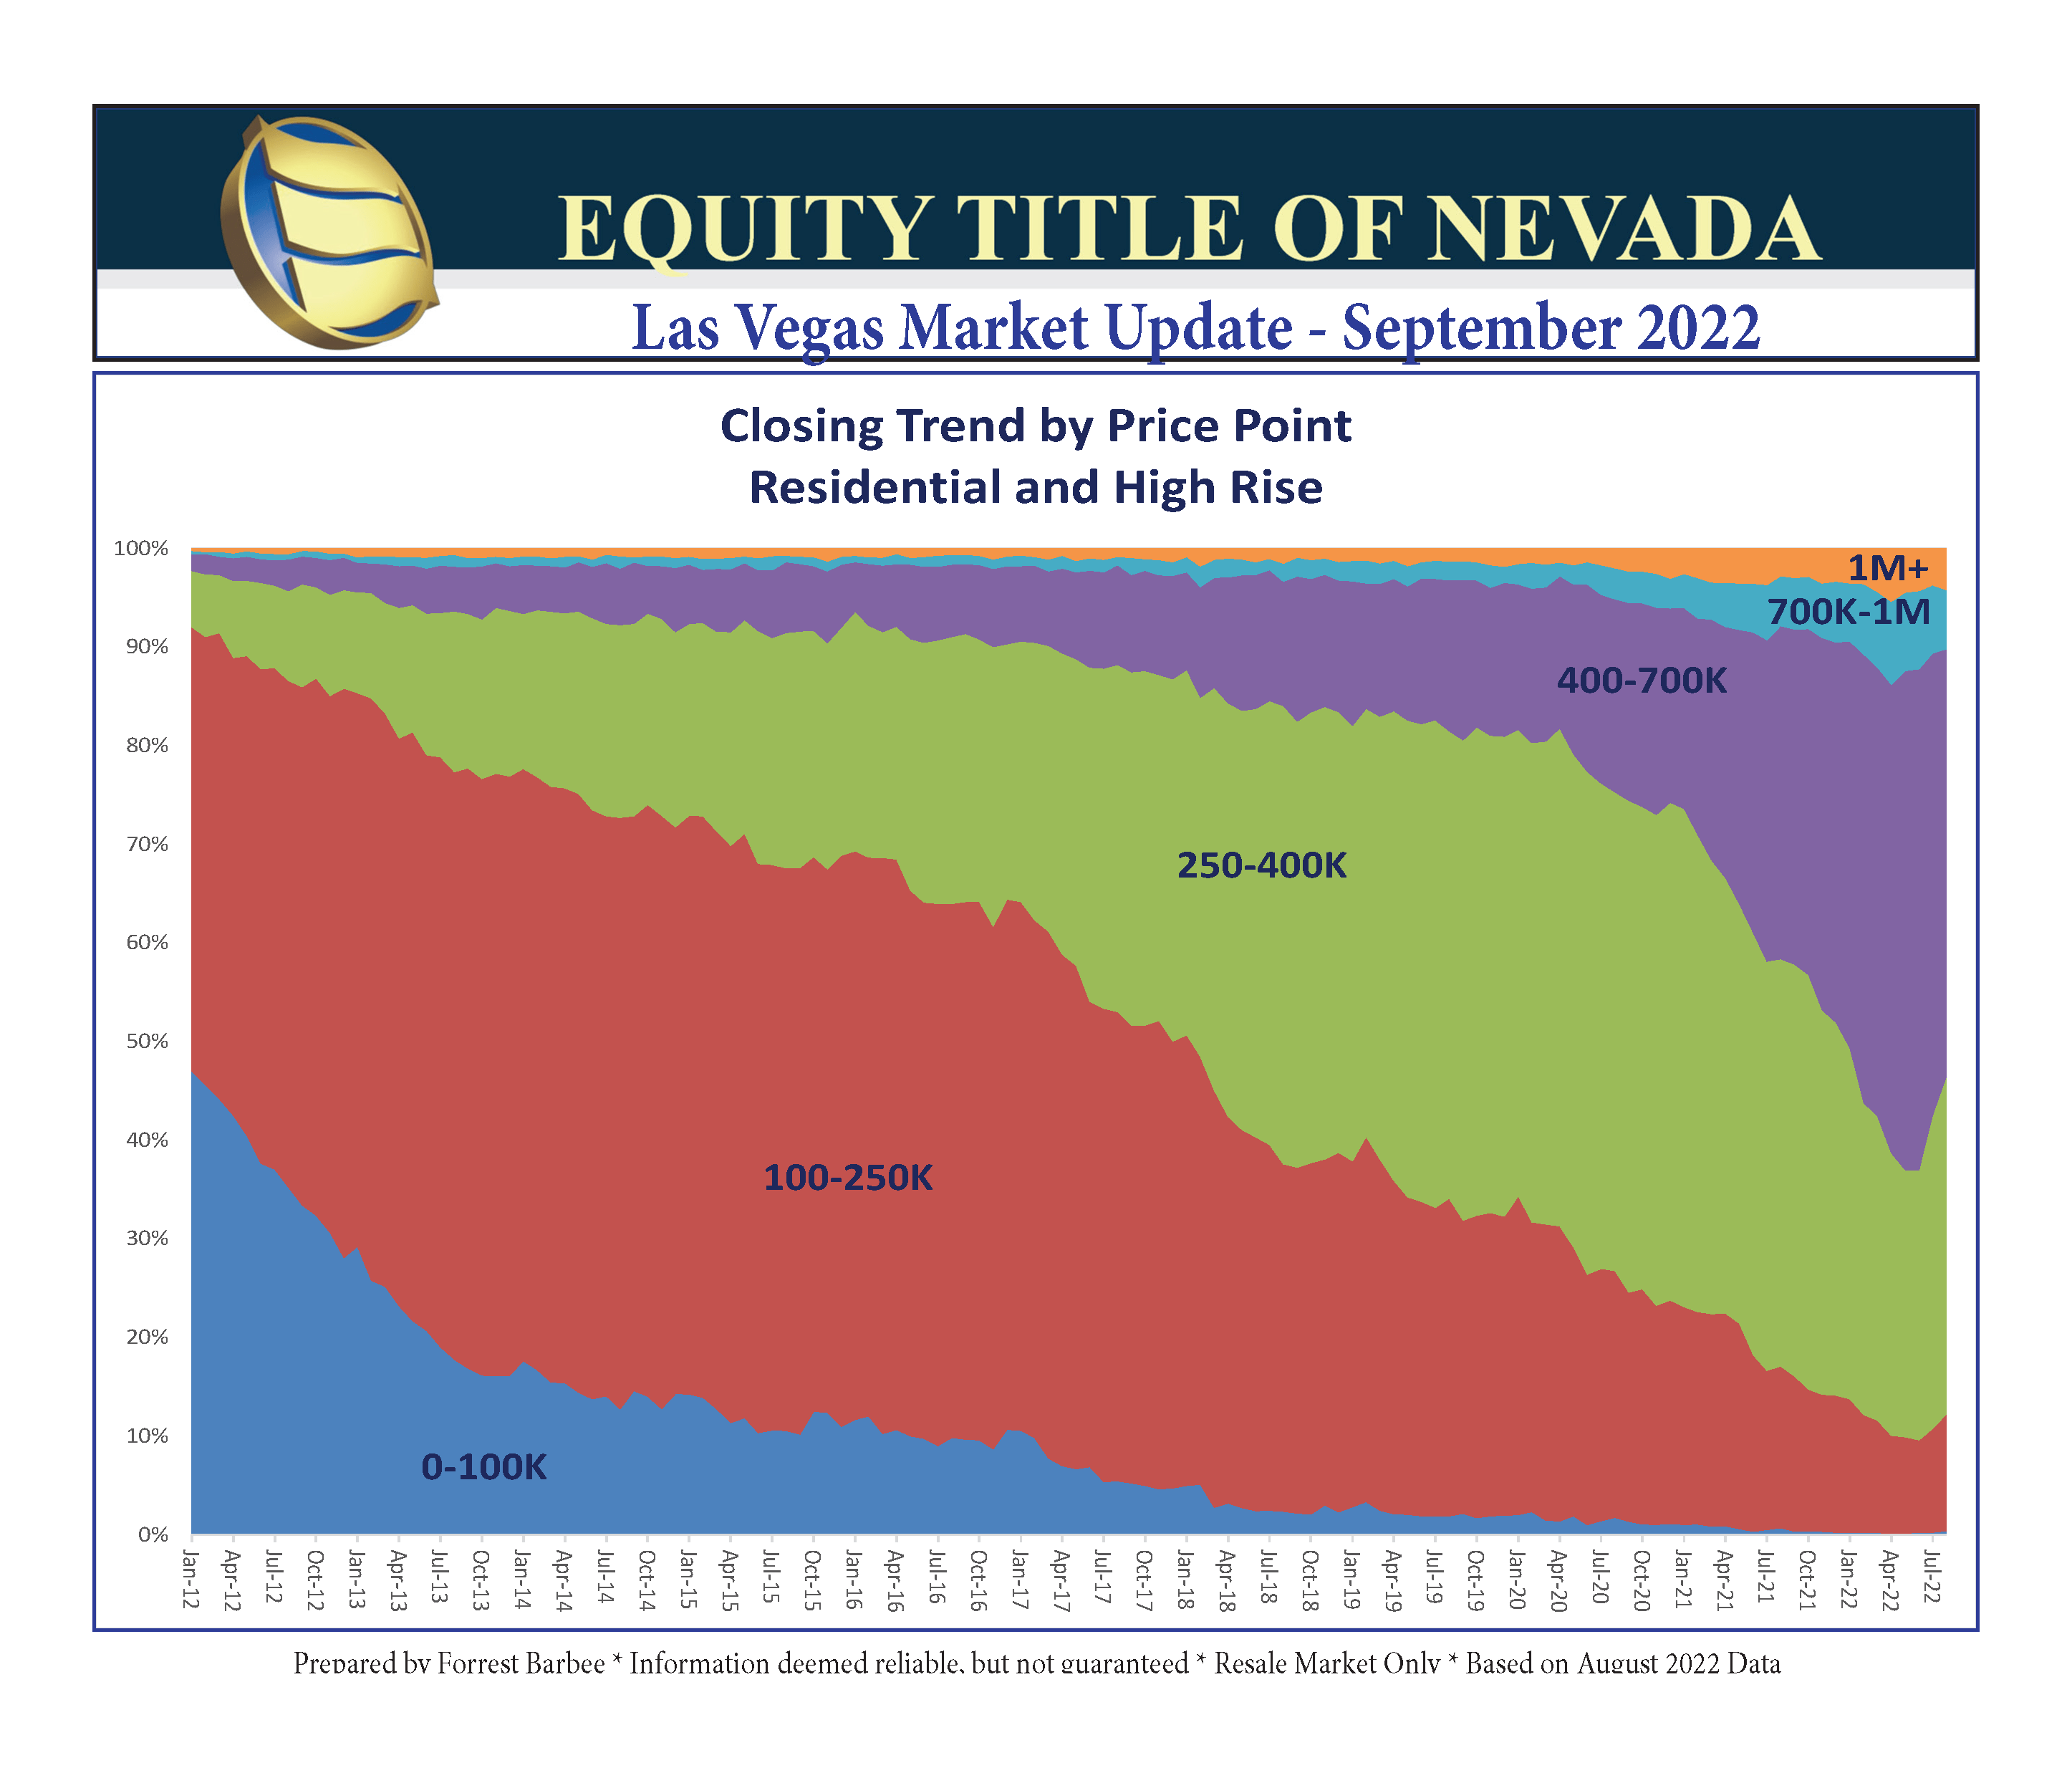
The median sales price of SFR closings dropped from $465,000 from $450,000 while the SFR average closed sales price fell from $544,598 to $540,773 for a decrease of 9% since the June peak. The luxury market closings increased to 118 last month with a modest increase in market values. Clearly, more closings are occurring at lower price points. The last chart below really shows the shift in sales by price point.
One caution – market prices are not falling consistently across the market as evidenced by rising prices in the luxury market! Each community, subdivision, and price point must be considered on a case-by-case basis.
Who Moved Your Cheese
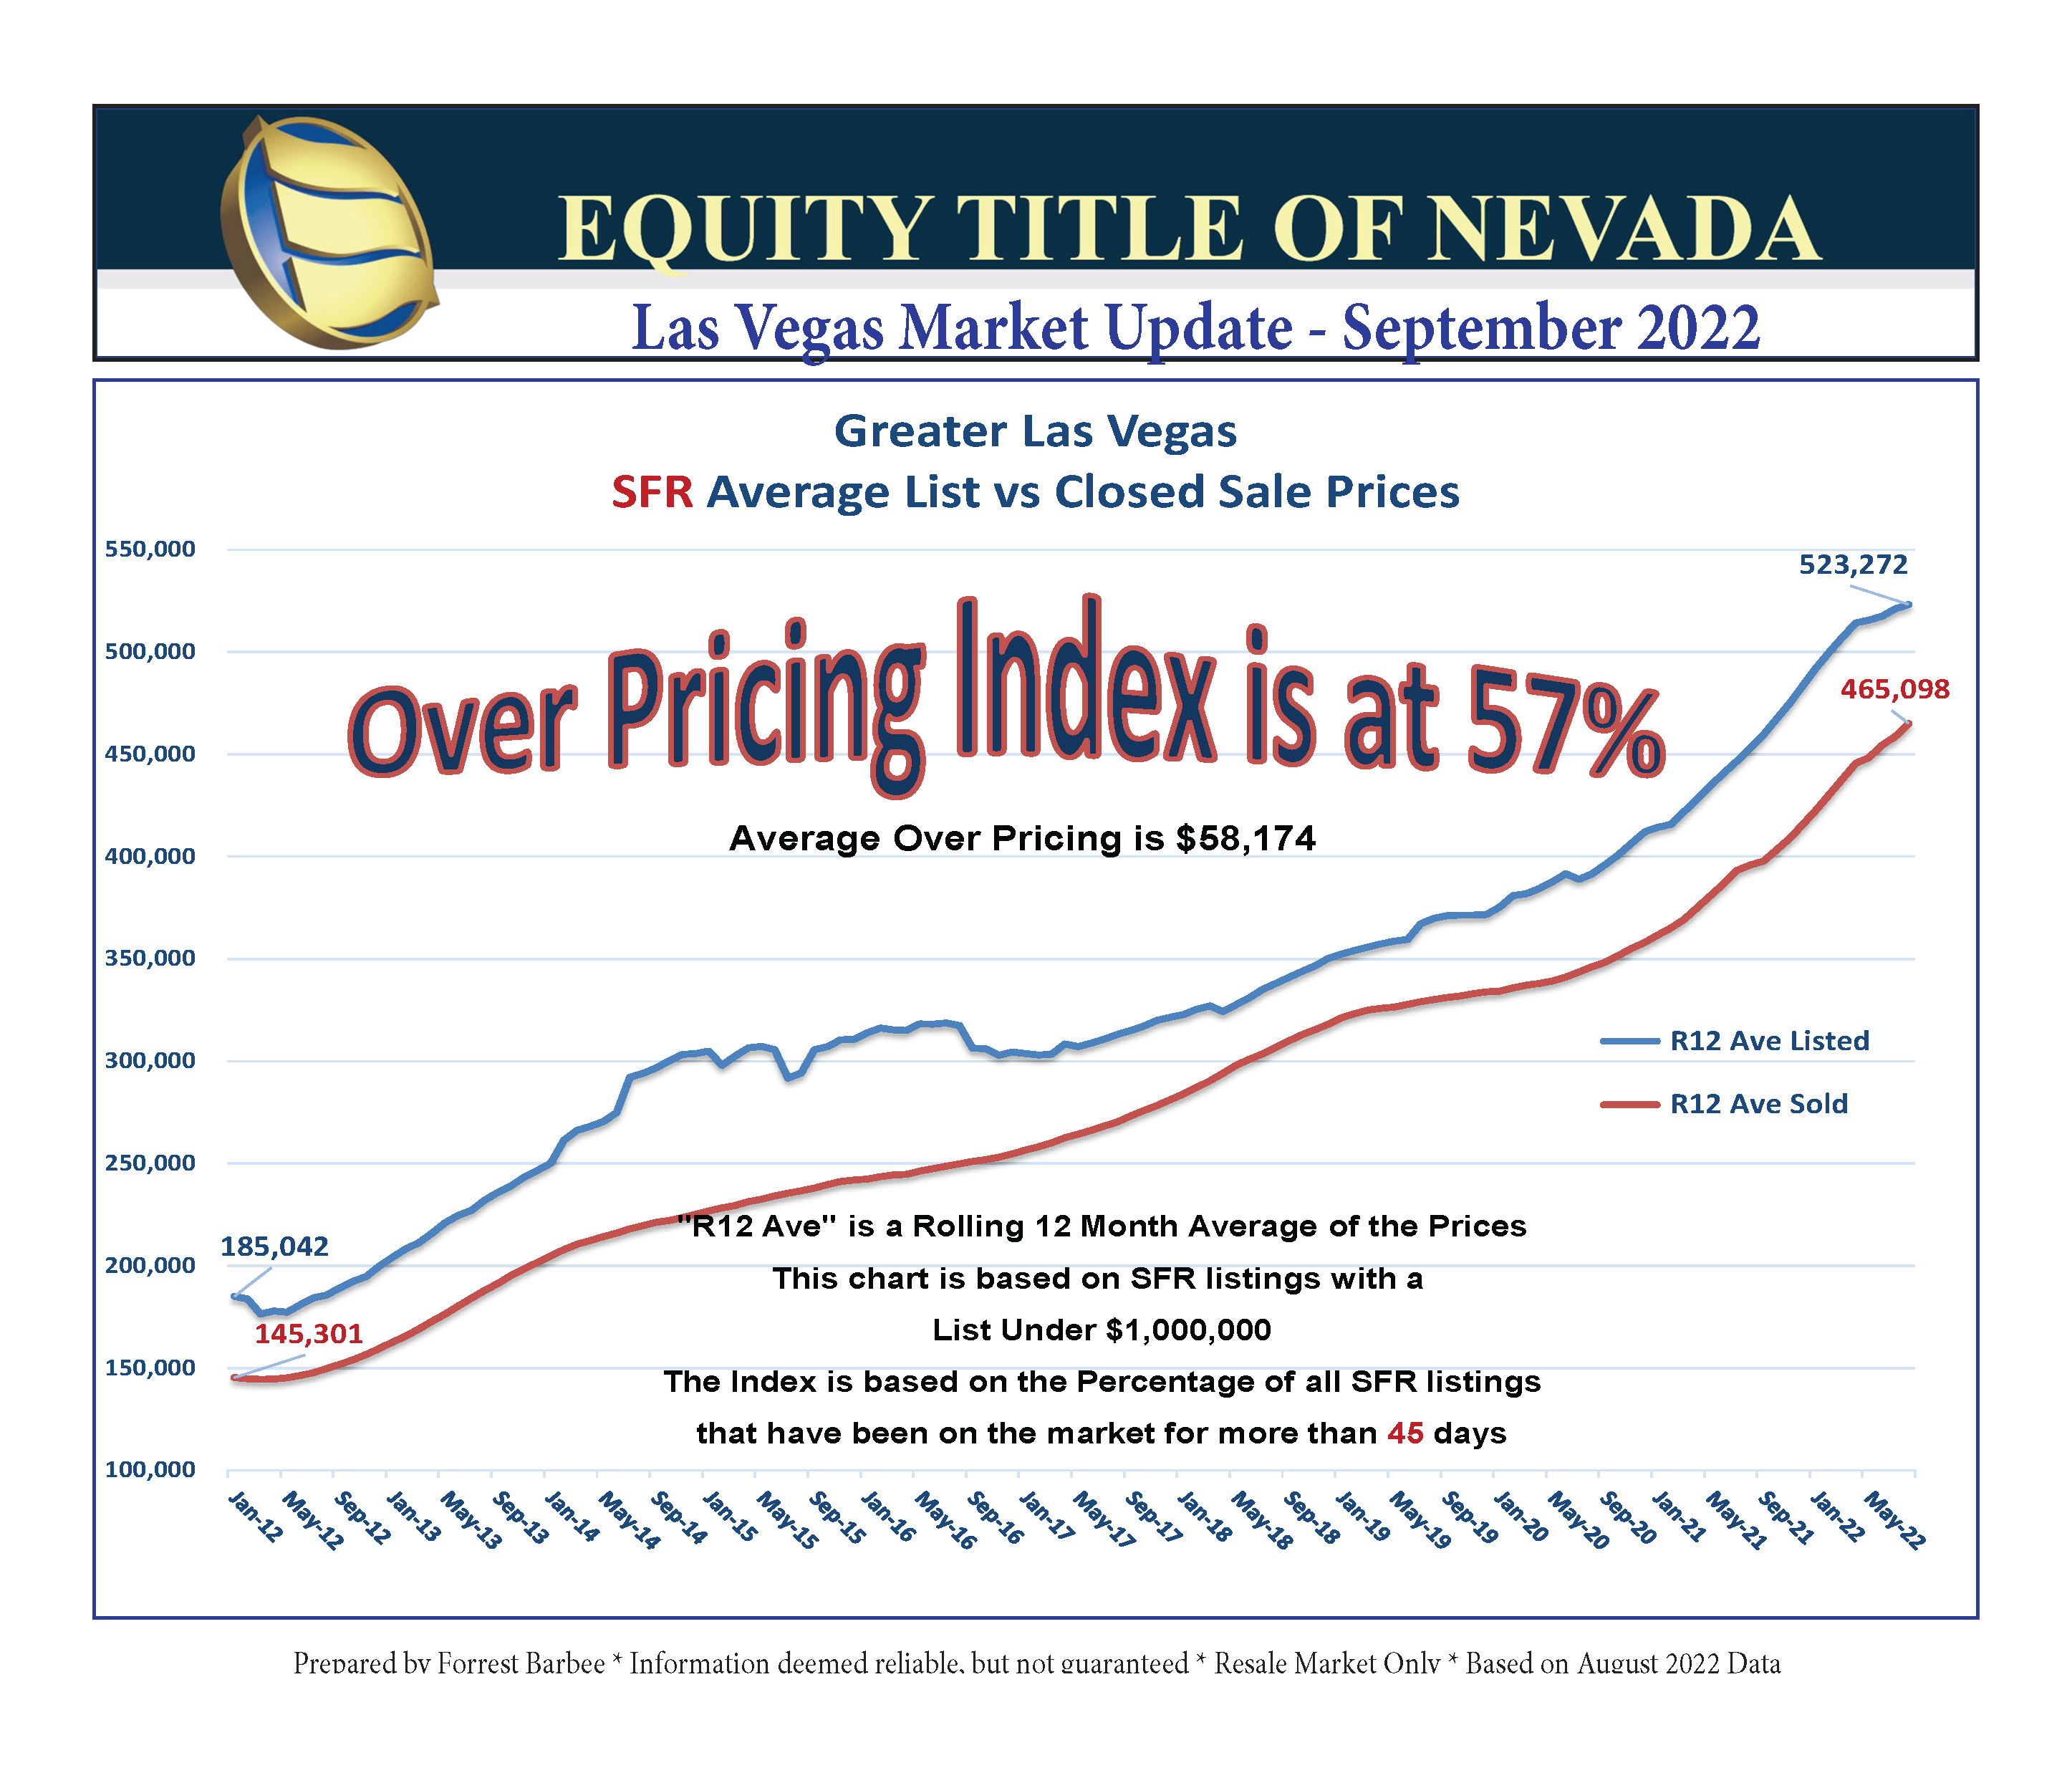
The real estate market has rapidly gone from only a few weeks of marketable inventory to nearly 5 months of inventory. That coupled with flat sales and a significant drop in listings taken have caused the over pricing index to jump to 57%. Listing agents must seriously consider the current supply and demand profile when preparing a comparative market analysis for sellers.
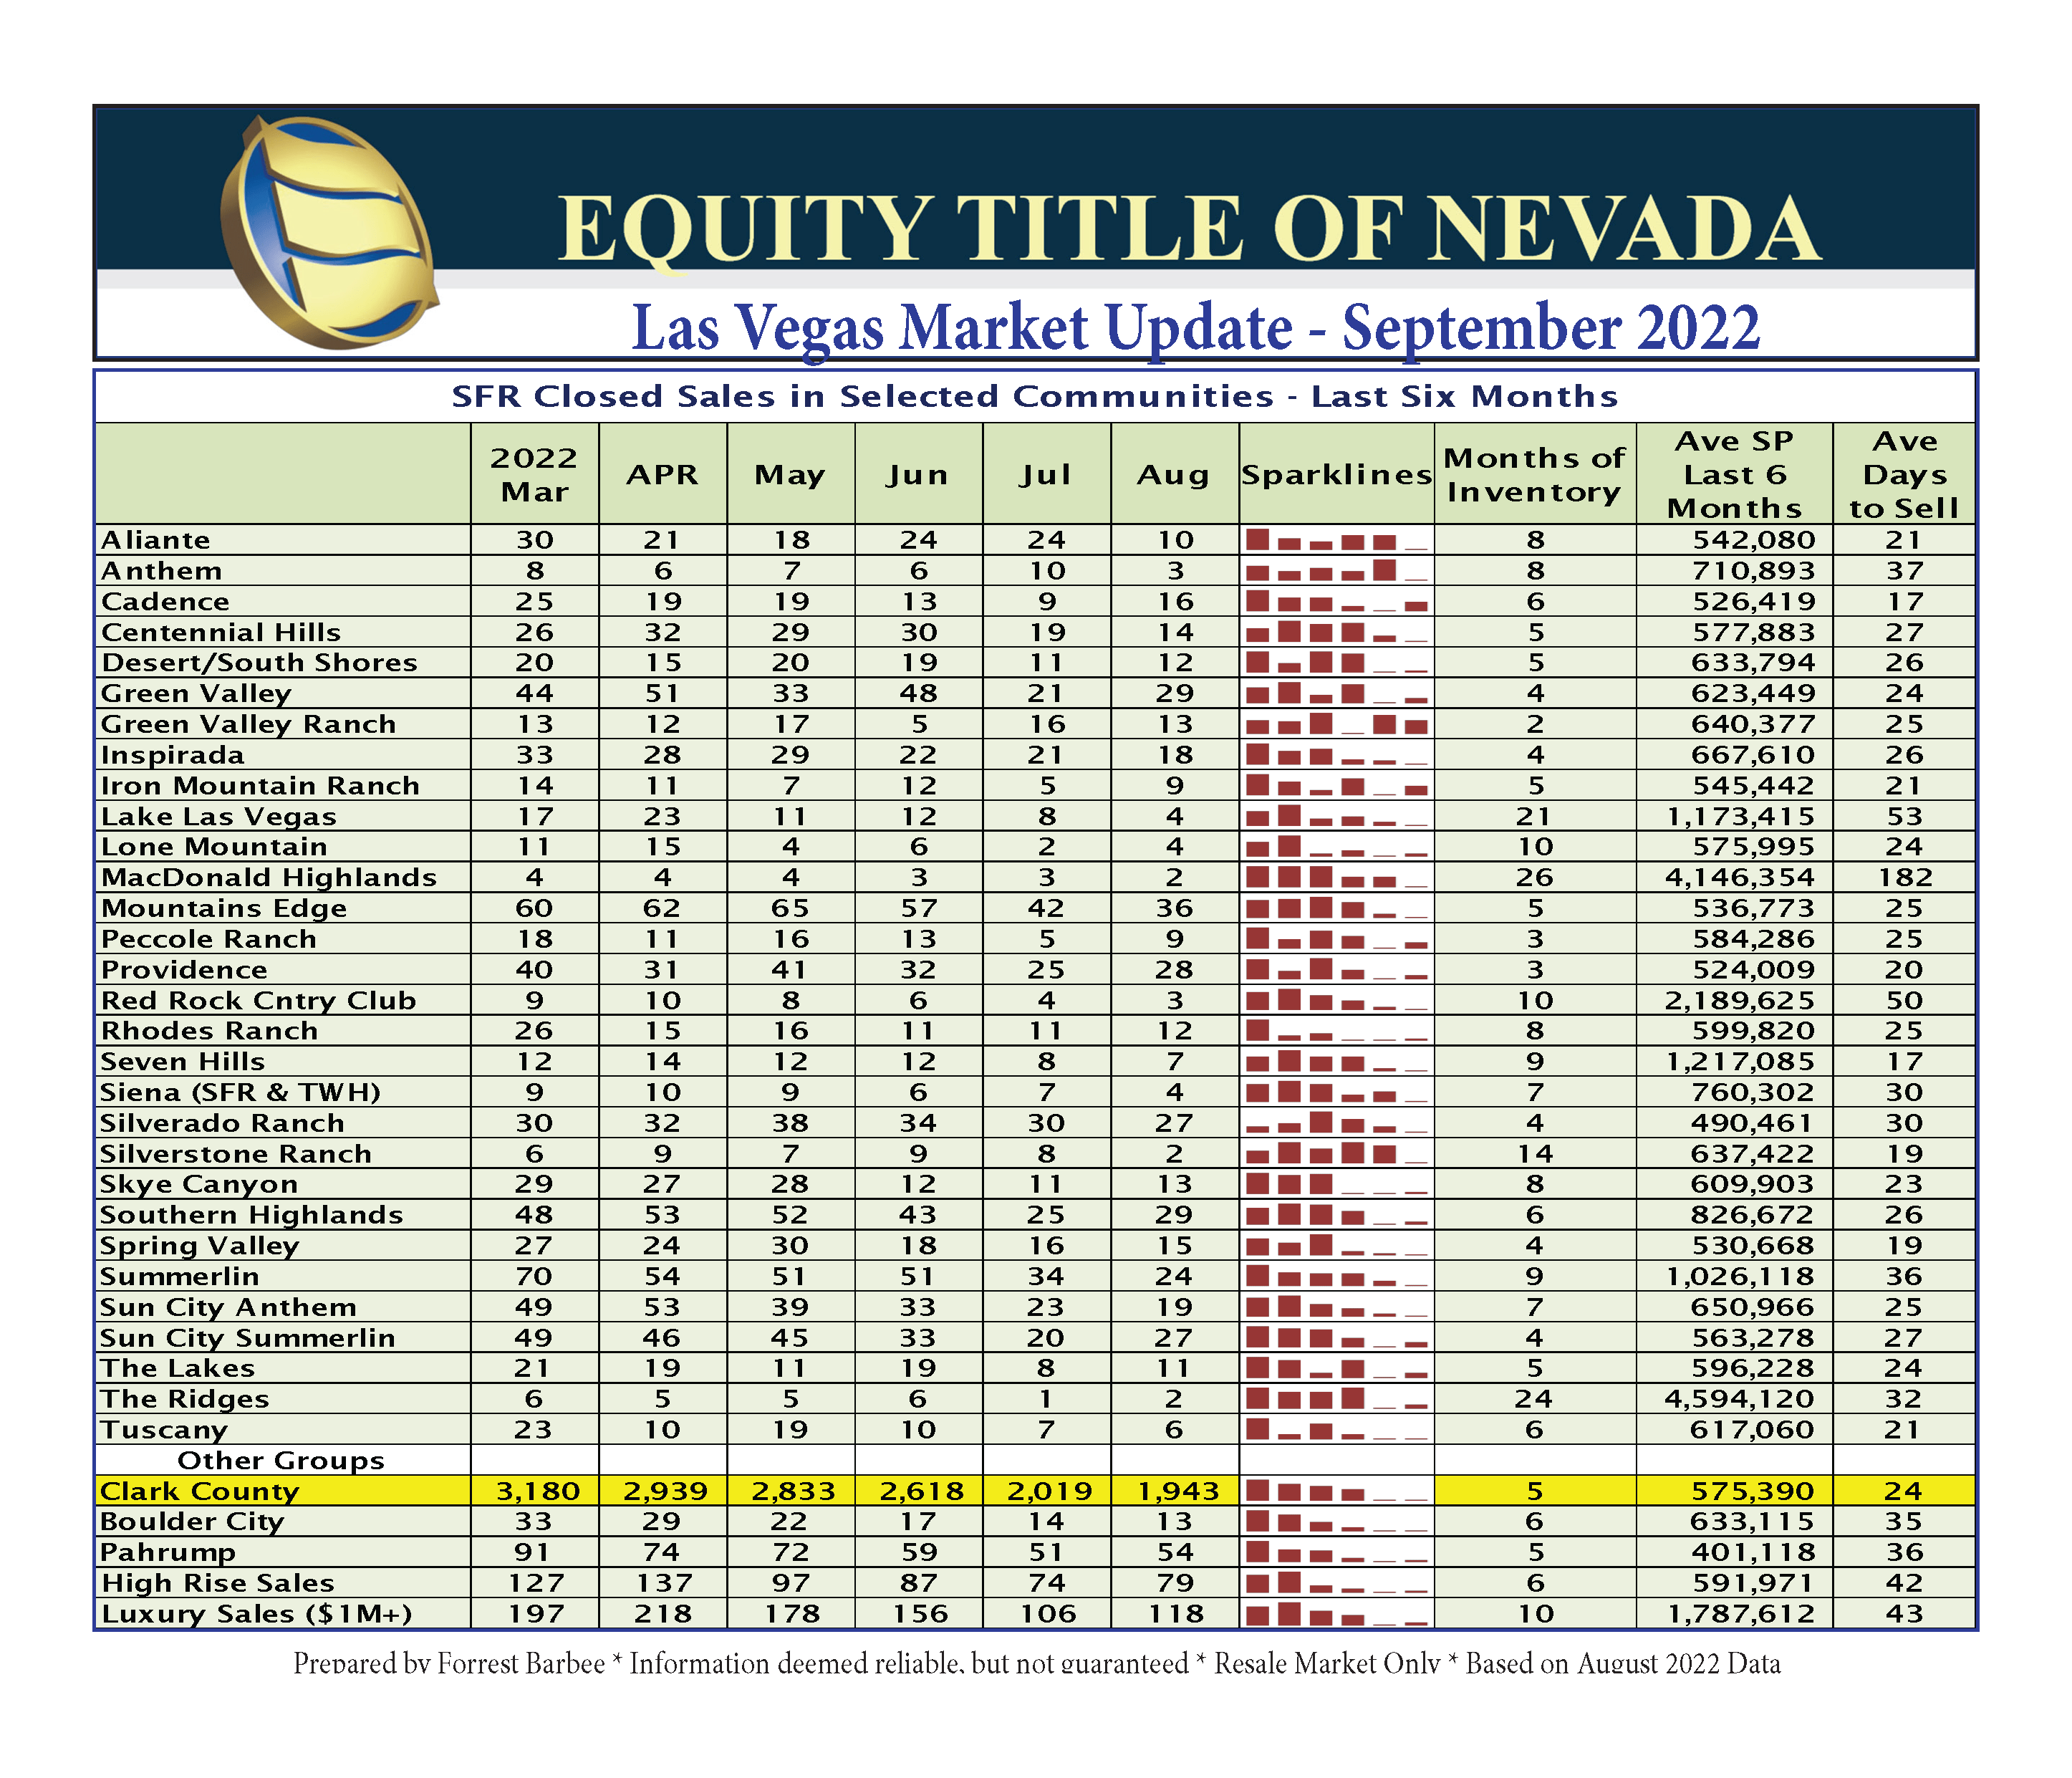
Clearly a balanced market is most welcome as has already begun to slow down the double digit rise in market values. Listing agents may need to get a grip of the shift and hone their sales and negotiating skills while adapting to these changes. However, that’s the macro-view of the market. The chart below shows that various communities around the valley are each responding to the market changes in their own way – with a dramatic range in months of inventory. Some communities have two months of inventory while others range up to 26 months of inventory. Thus, a buyer’s or seller’s ability to negotiate will be – to some extent – tied to these numbers as they reflect each community’s supply and demand position. Seller’s whose circumstance are such that they cannot wait 8, 10 or even 16 months to sell may need to consider lowering their asking prices if their motivation to sell is more urgent! This is an event that could result in lower market values in some communities.
It’s time for all of us to adopt a change in mindset that reflects the current market and economic conditions in the specific market areas we work. Temper news and media reports on the market with that in mind. Then pass accurate market conditions on to your clients and prospects! It’s also a good time to take another listing since those priced properly are selling much faster than the others.
Property Management Permit Pre-Licensing Class
24 Hour Online Format

Online Continuing Education Class – Broker Management

