Current Las Vegas Market Individual Charts
Current Las Vegas Market Report
Market Overview – September Stalled Year Over Year
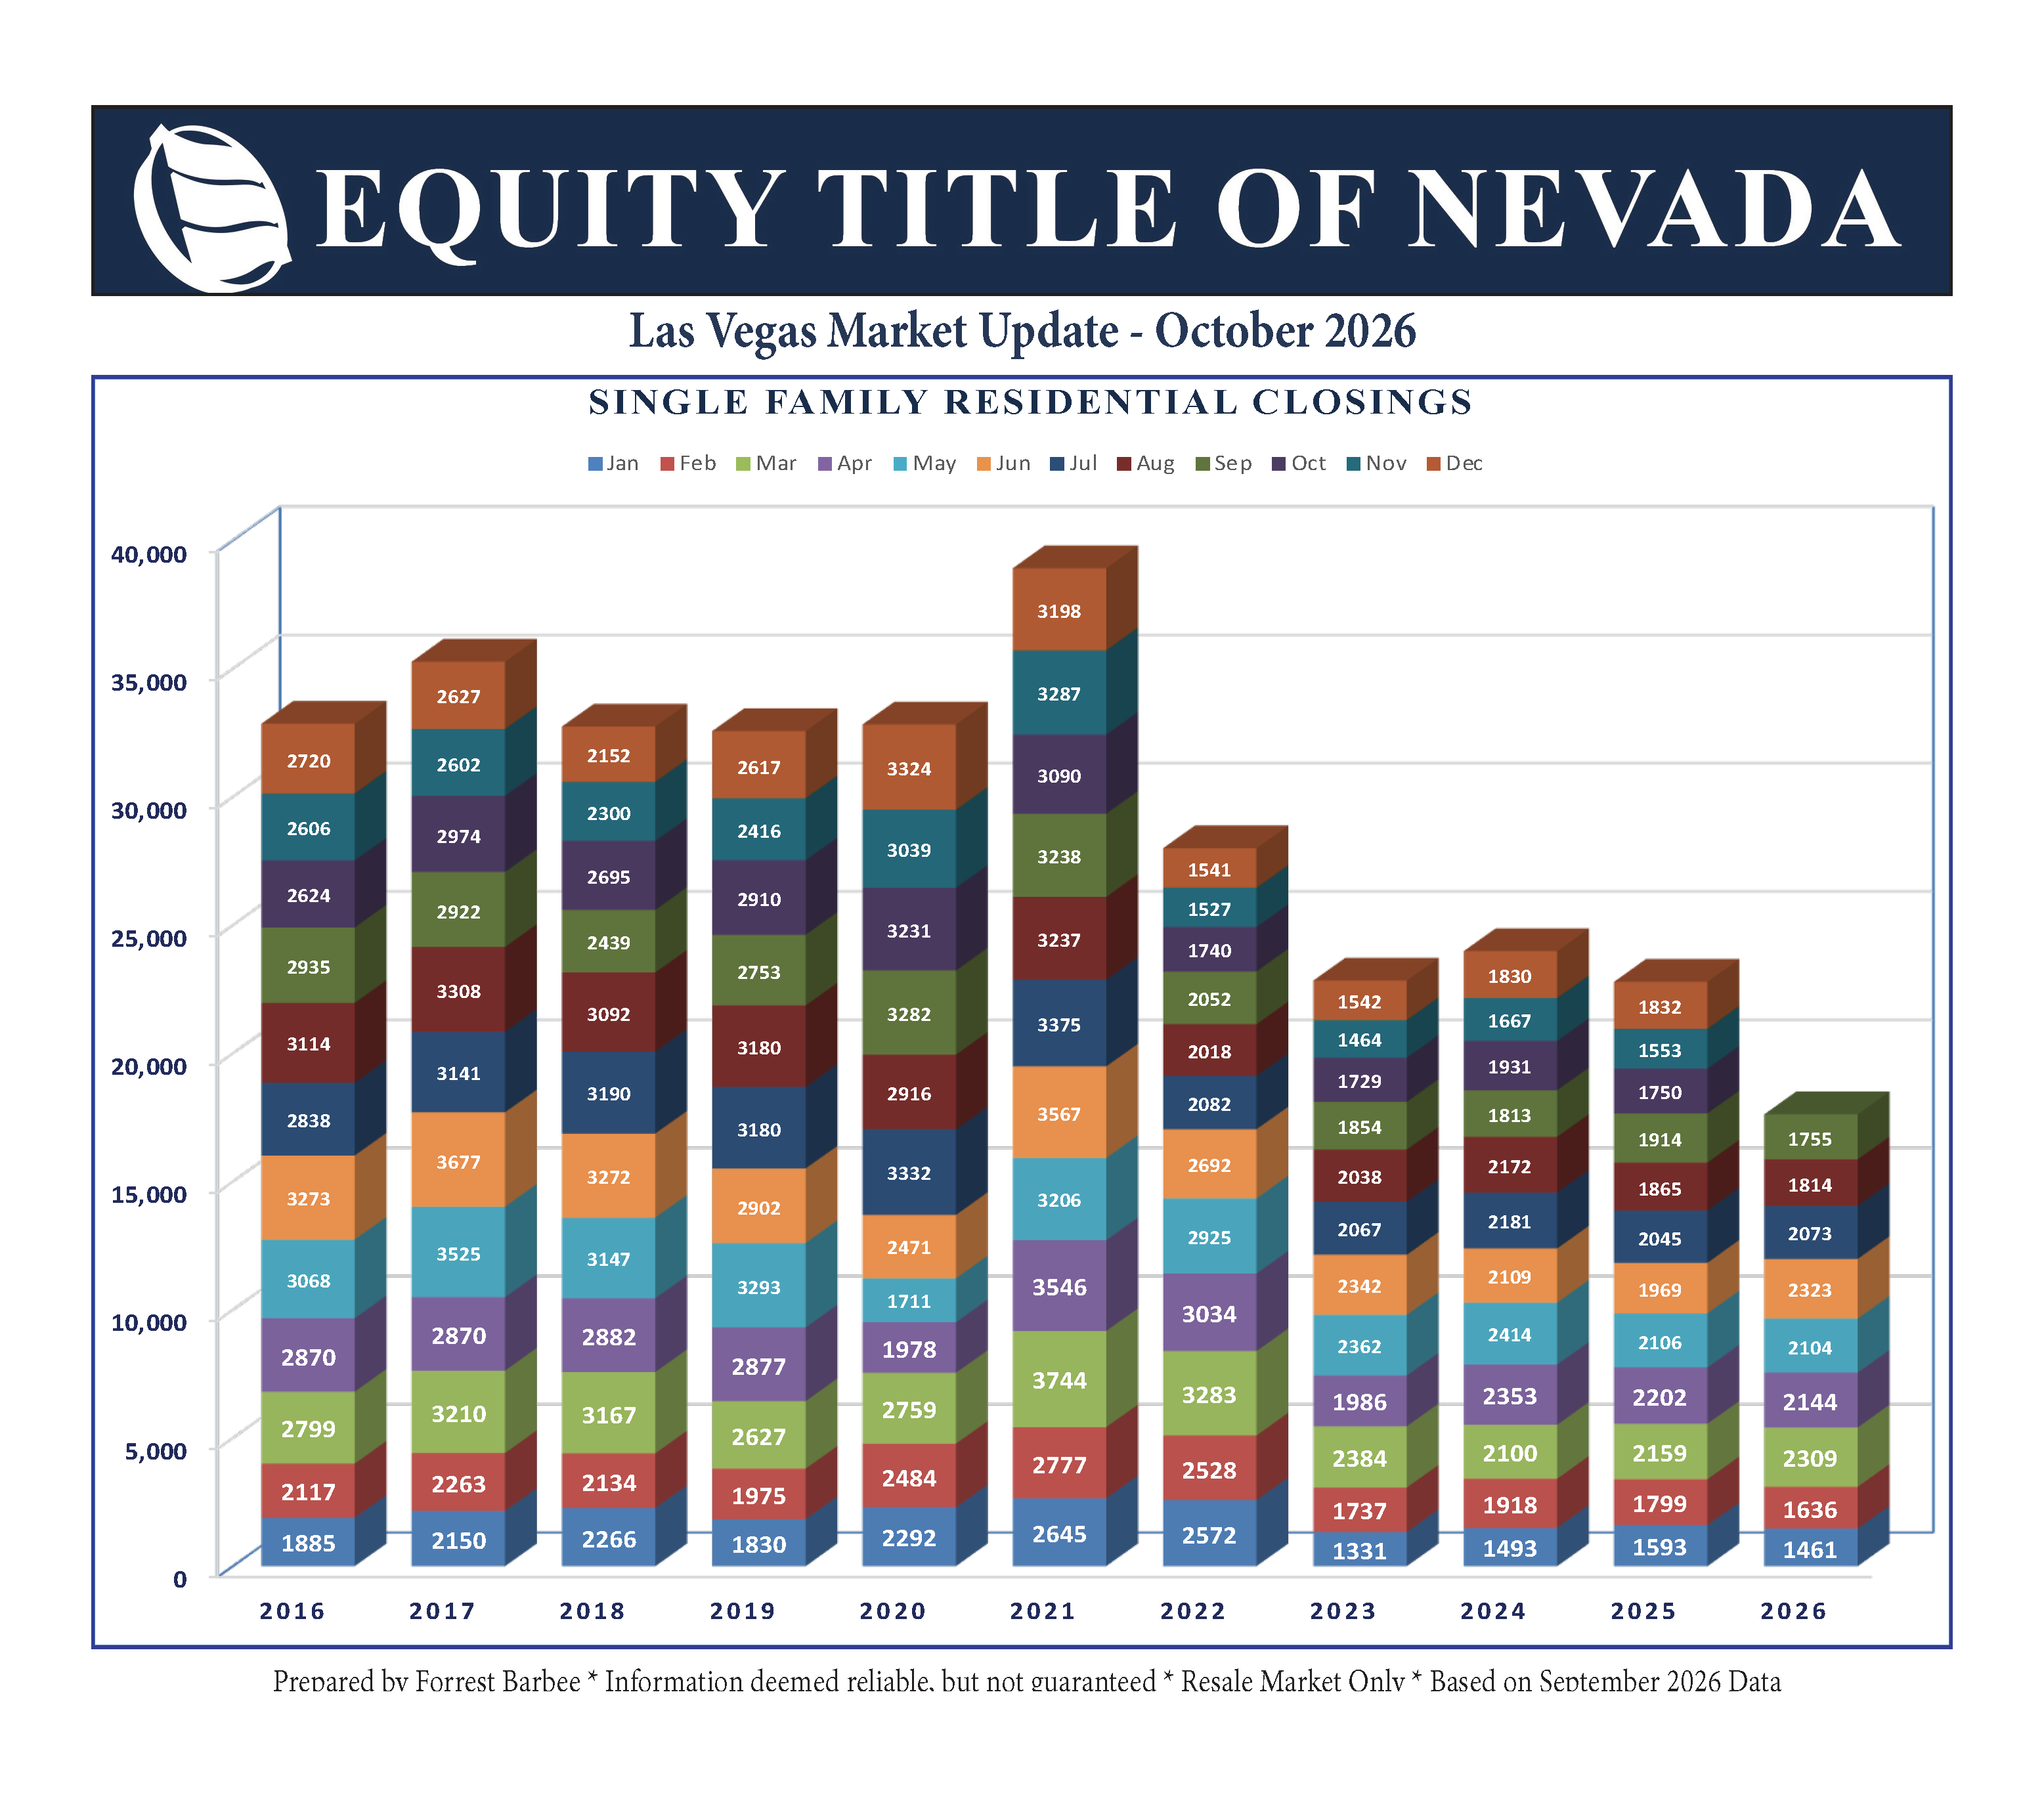
The 2026 Greater Las Vegas real estate market slipped in September with sales volume at 2025 levels. However, closed sales are now 2.2% behind last year’s closings at this point. The luxury market continues to pull the market forward by outperforming 2025 closings, but slowed a bit in September as well.
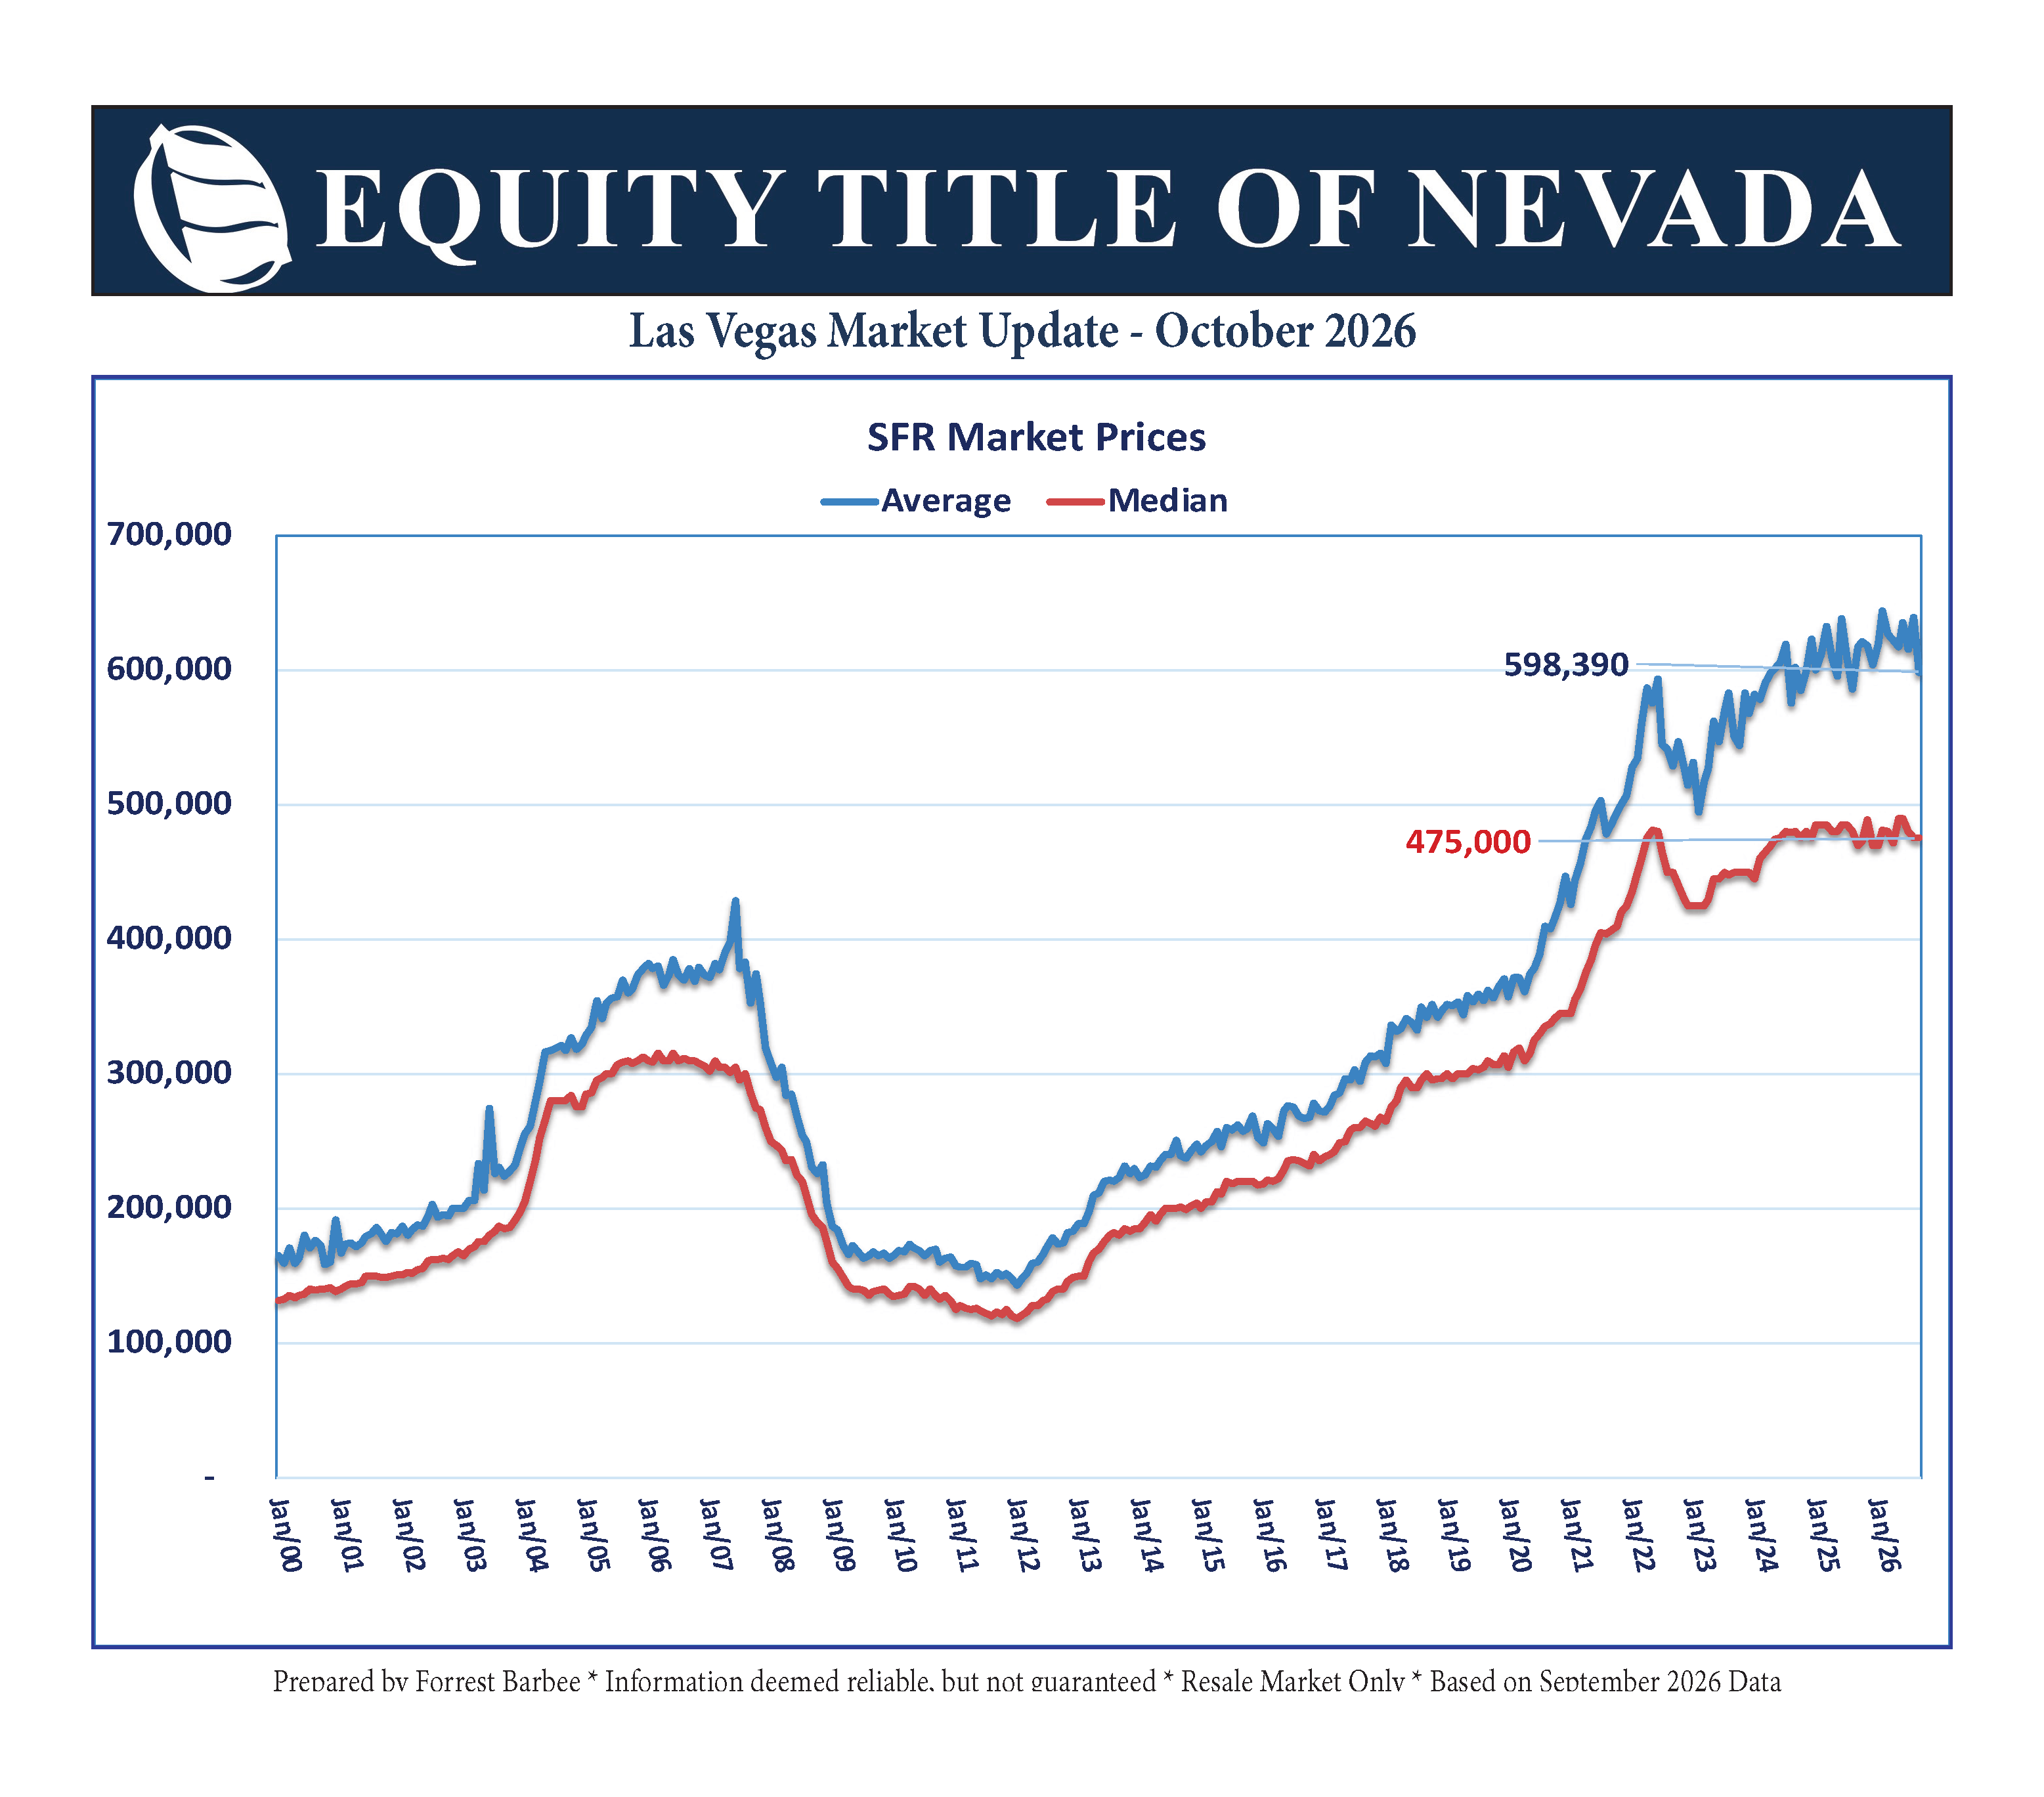
- the Median price of SFR is flat at $475,000.
- the Average price an SFR closing dropped from $639,579 to $598,390
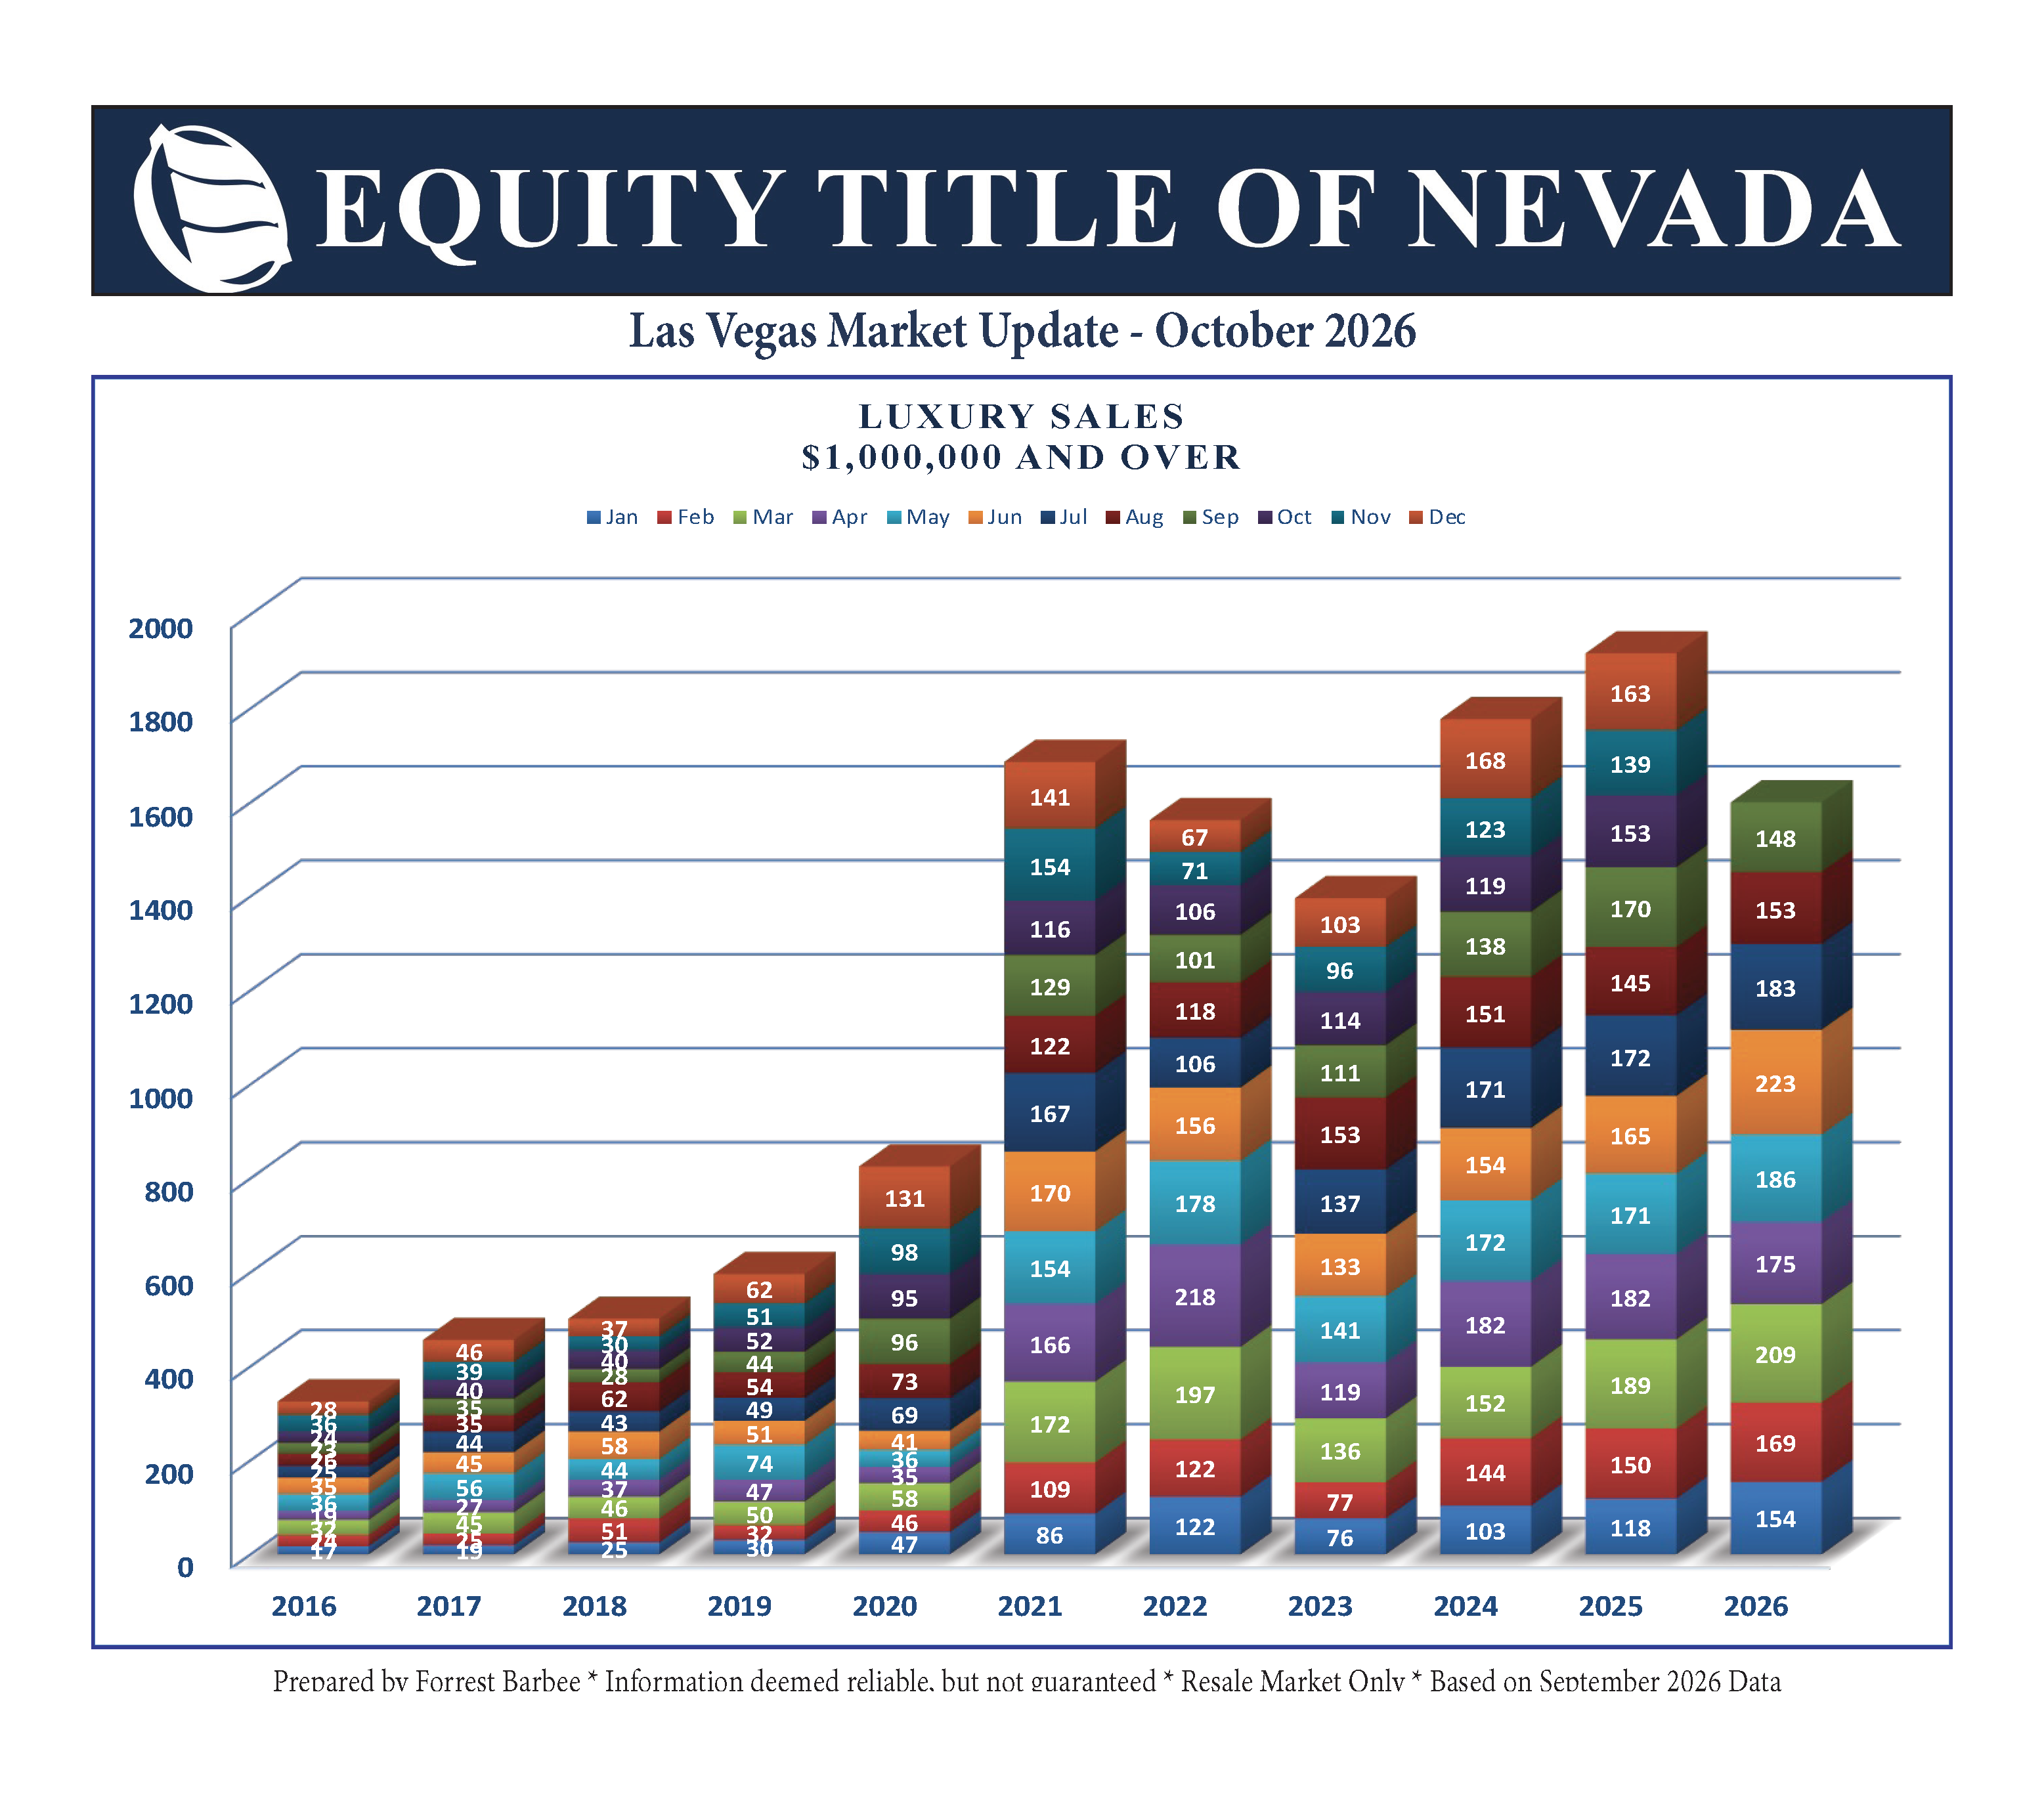
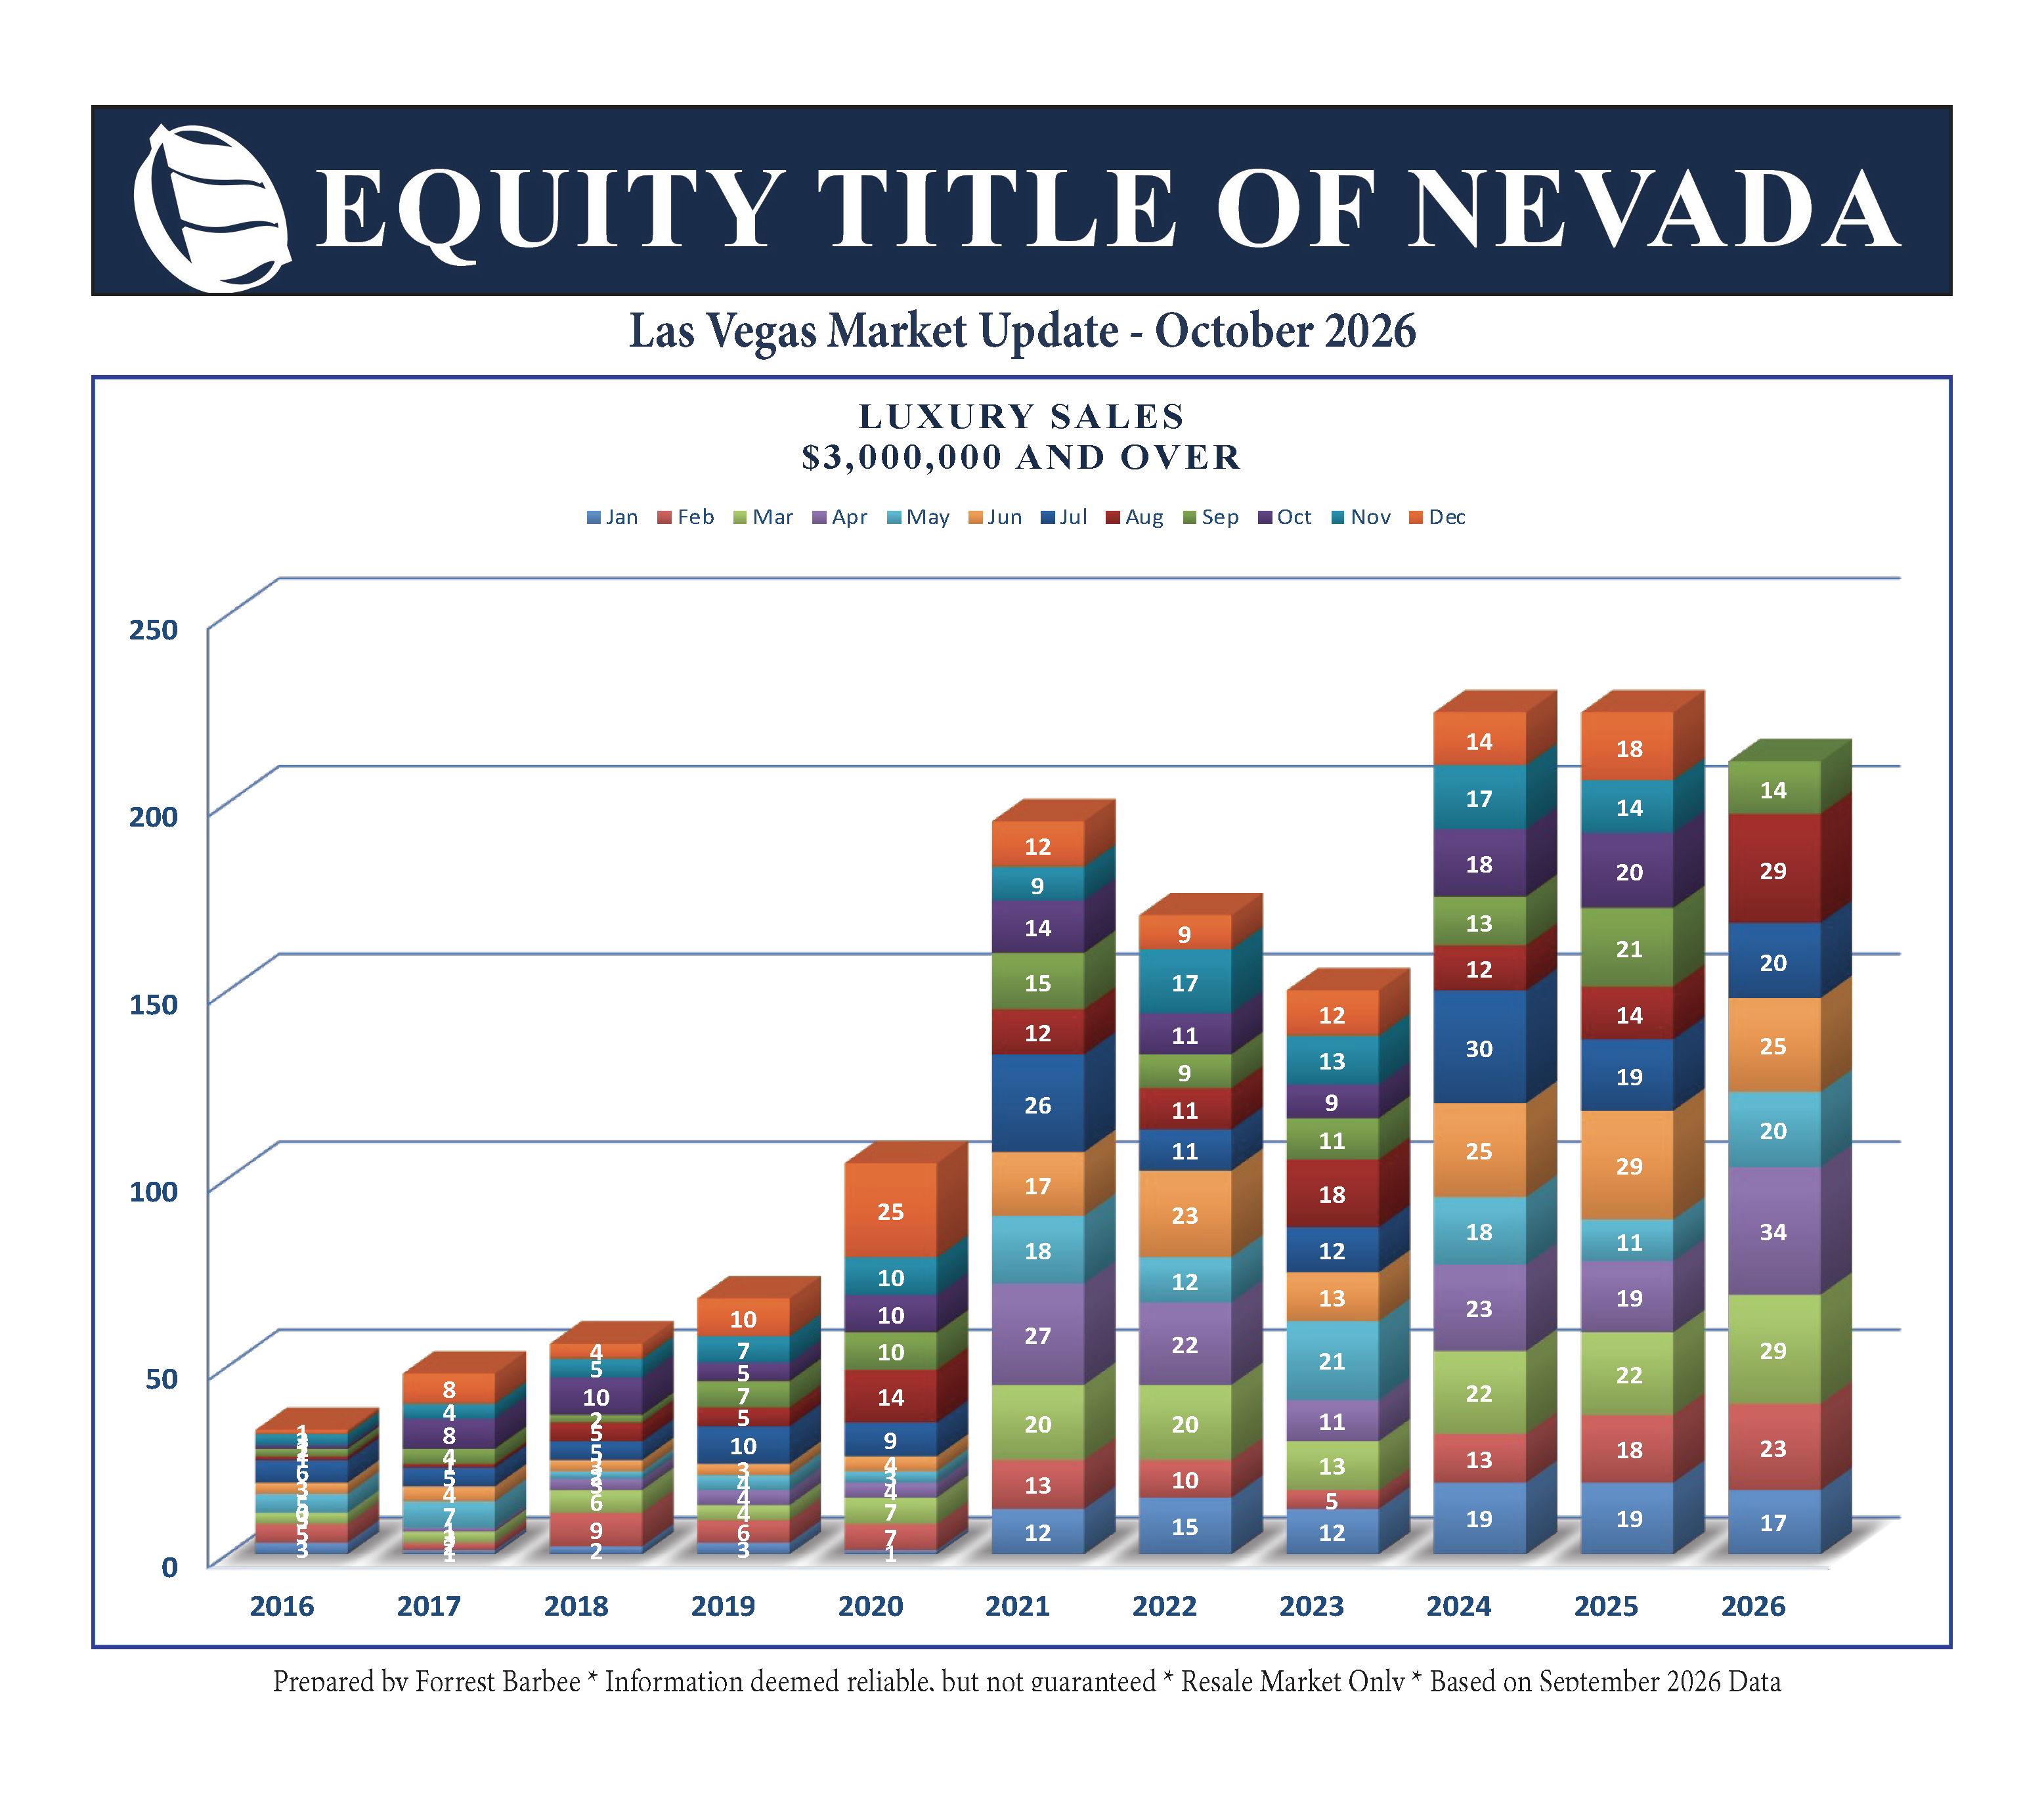
The gap between the average and median sales price closed a little this month as the luxury sales slipped in closings and average sales price. Prices trended lower in general. The luxury market still led the September closings with 148 closings above $1 Million, including 14 above $3 Million.
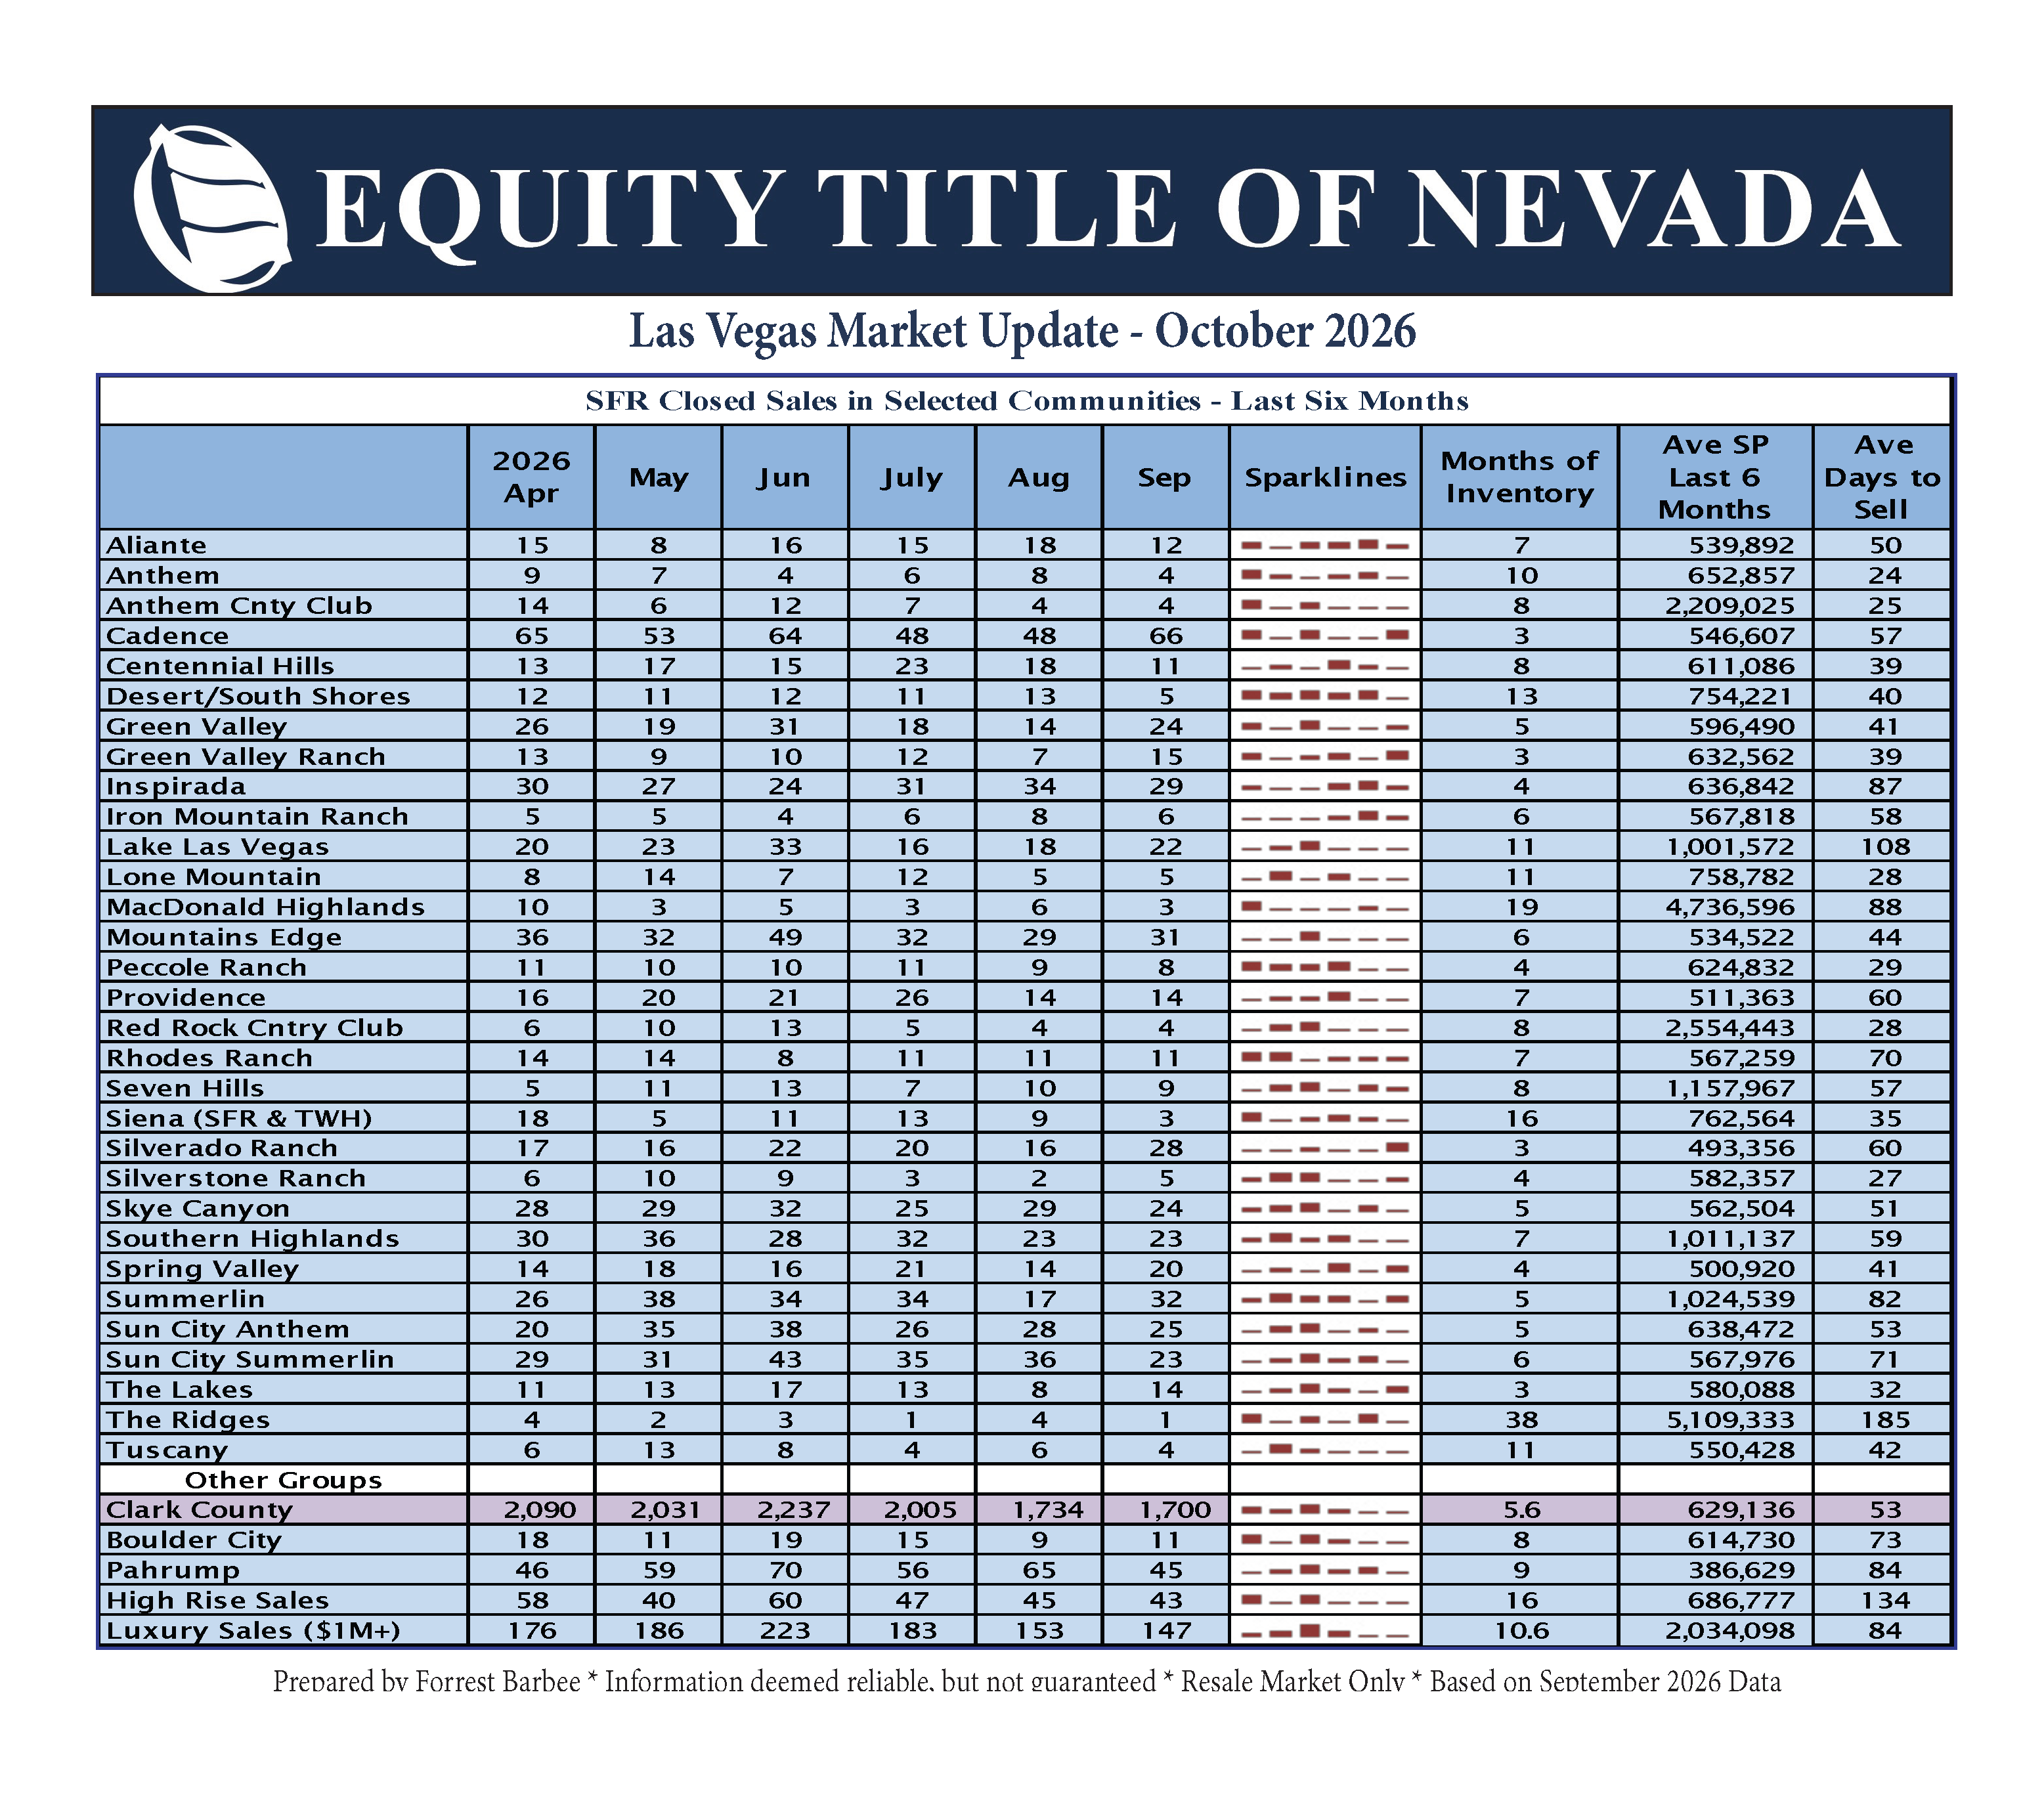
Overall, the residential market now sits at 6.2 months of residential inventory as the number of listings taken in August were approximately 100 fewer than in September while closings were only about 50 behind August closings. However, months of inventory vary widely by community with some areas only having 3 months of inventory on the low end and 38 months of inventory on the high end.
Pending units continue dropping as available units increased sharply. Meanwhile, the Over Pricing Index is sitting at 53% with 27% of all available listings have been on the market for at least 90 days without going into escrow.
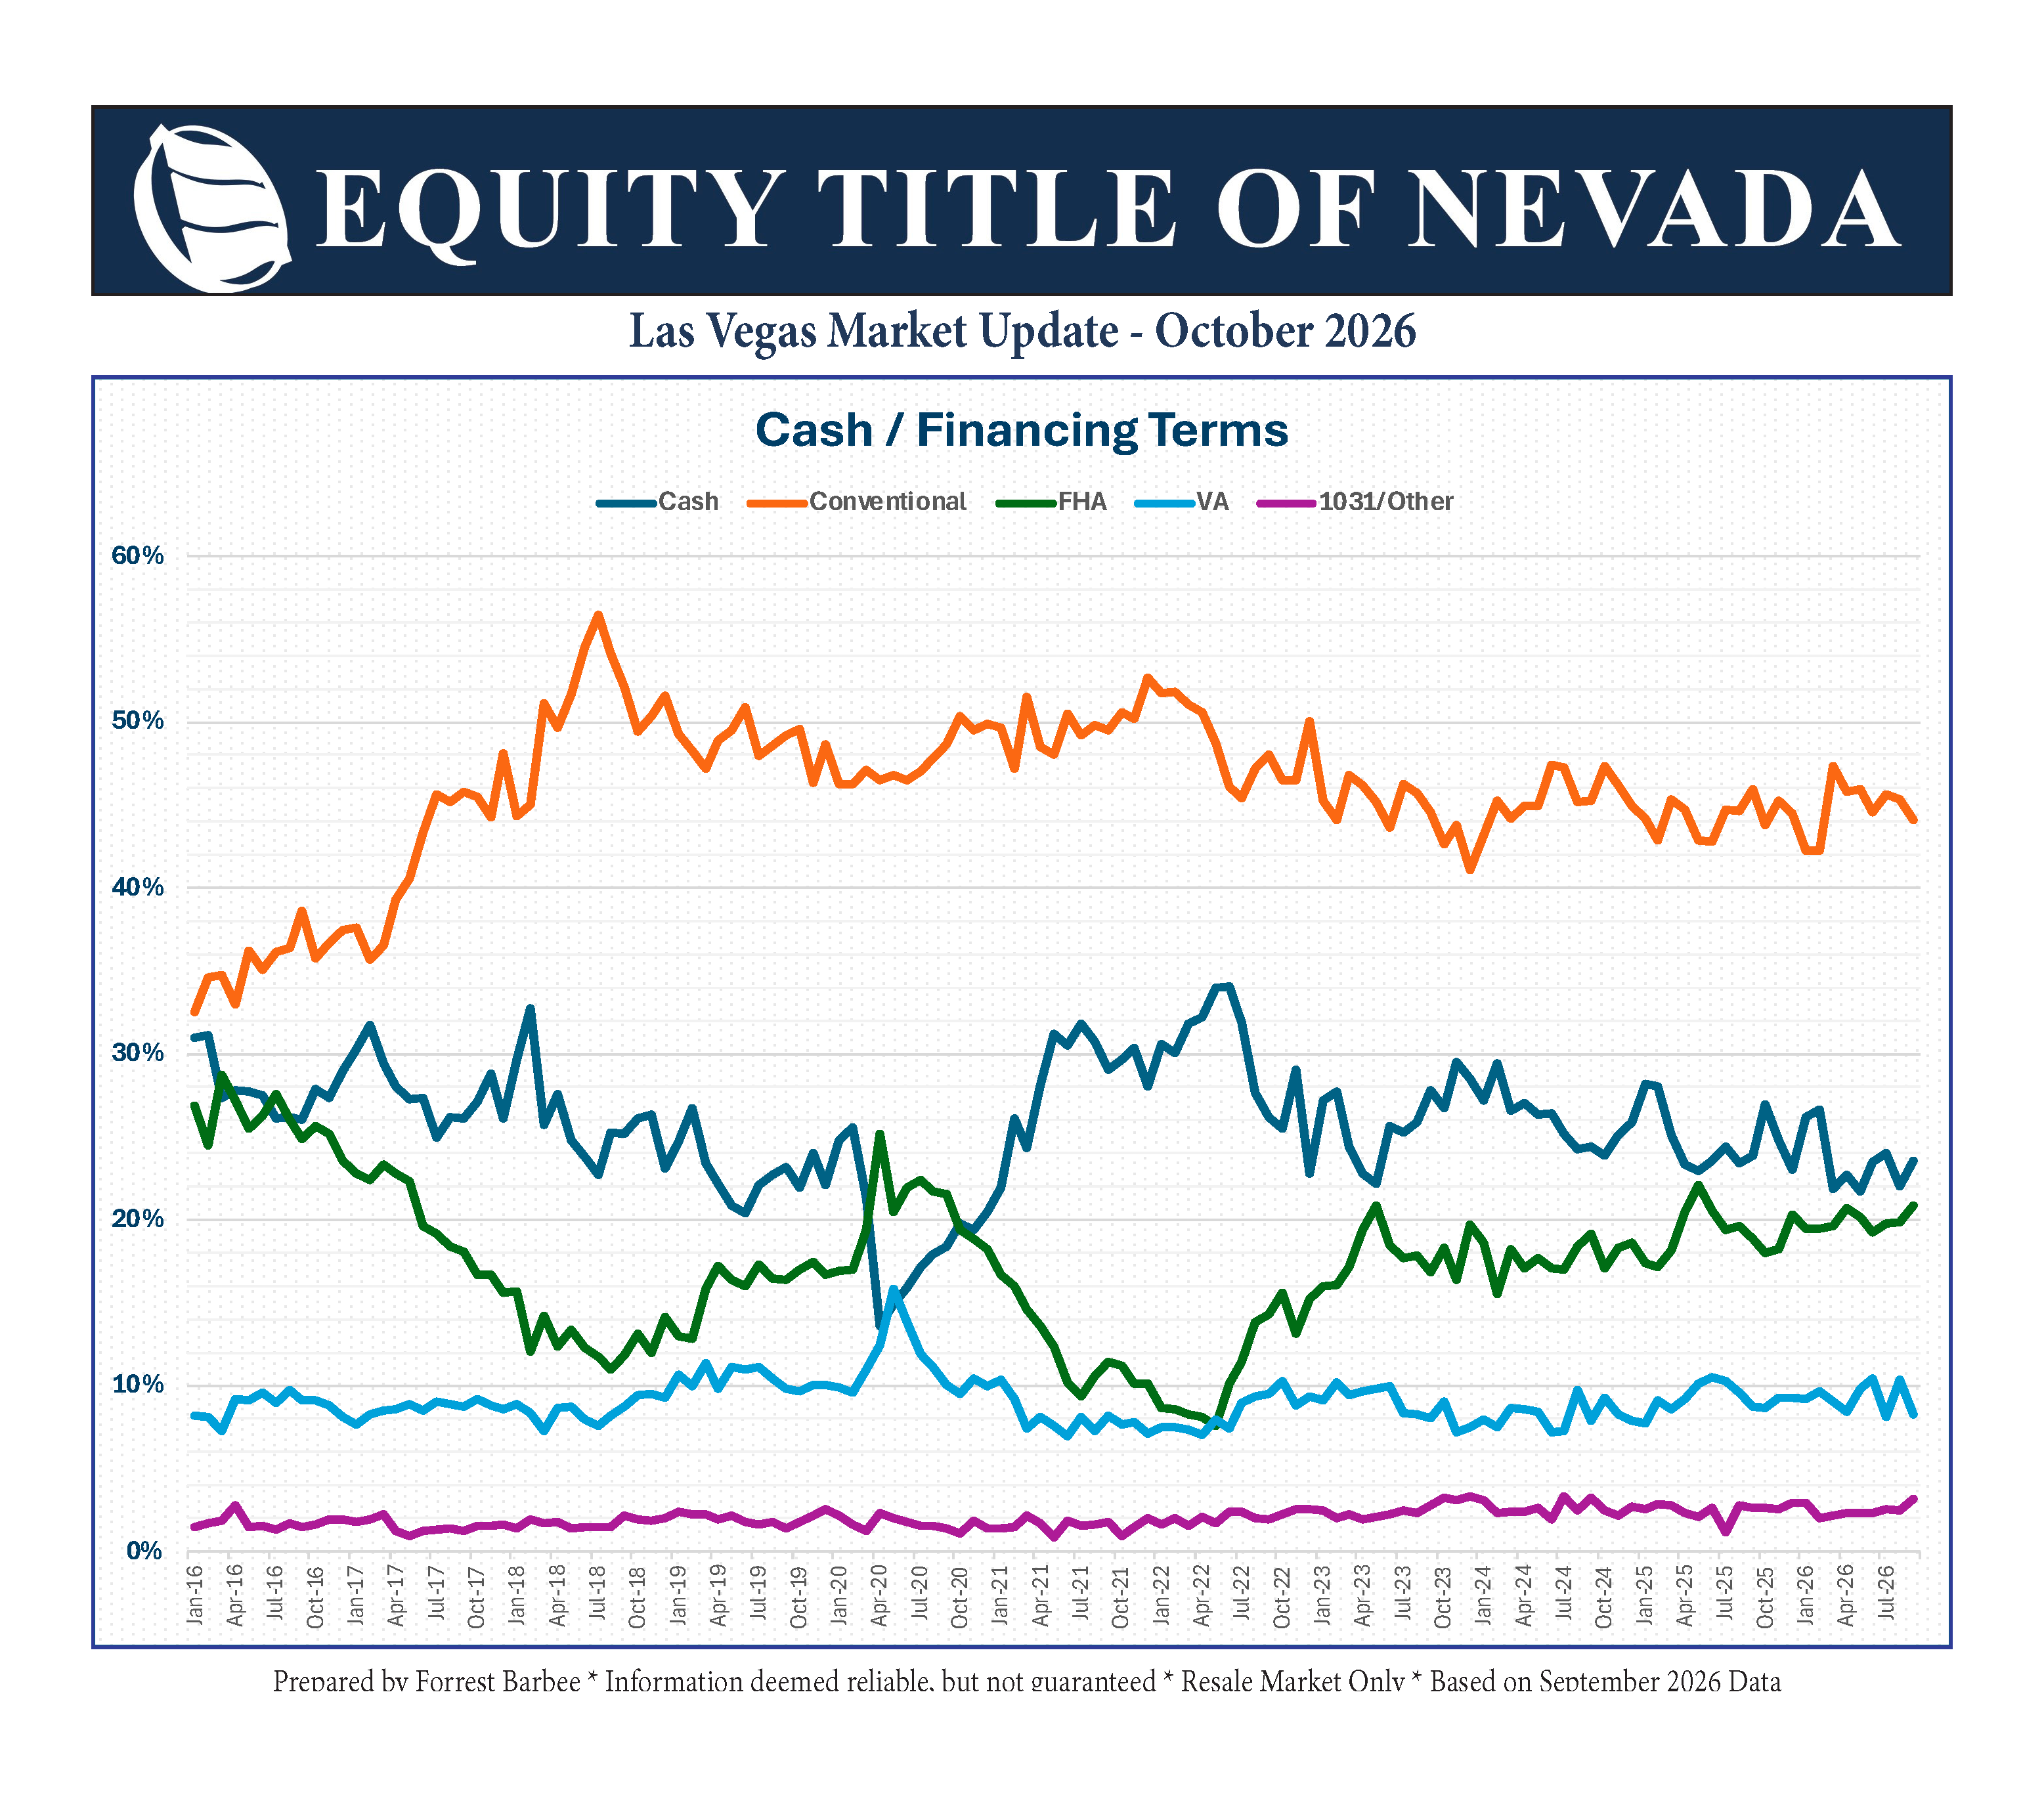
Finally, check out the Cash/Financing Terms chart below. Cash, conventional financing, and VA financing are retreating. Only FHA and Other are rising!