 New Residential Purchase Agreement – Biggest Change in Ten Years!

It was ten years ago that we first introduced a standard Greater Las Vegas Association of REALTORS (GLVAR) Residential Purchase Agreement (RPA) that was generally adopted by most brokerages in Las Vegas. The upcoming version of the RPA introduces the most substantive changes since its adoption. Personally, I like many of the changes, but not everyone will agree with me. That’s okay! Reality is that each legislative session enacts new laws that often require changes to a number of our standard GLVAR forms. This is why a number of other states have gone to statewide forms for real estate transactions. State associations such as the California Association of REALTORS (CAR) and the Arizona Association of REALTORS (AAR) are the authors and keepers of those forms. That makes so much sense as it is the state associations that tend to monitor federal, state, and local legislation and ordinances. The attorneys in those associations then update their state forms shortly after their legislative sessions conclude. Ten years ago we tried and failed to launch a set of statewide real estate forms in Nevada. However, given how much the business of real estate is impacted each year by federal and state legislation, perhaps it’s time for state and local real estate leadership to review this issue. I will gladly volunteer some of my own time if there is an interest.
Las Vegas Market Overview
August Single Family Residential (SFR) closed sales are up 9.3% from July and 8.2% higher than at this time last year. The median closed sales price of a SFR retreated to $235,000 while the average closed sales price of an SFR dropped 2.4%, falling from $275,885 to $269,222.
Click Here for the current Market Update
Click Here for Additional Las Vegas Market Update Charts
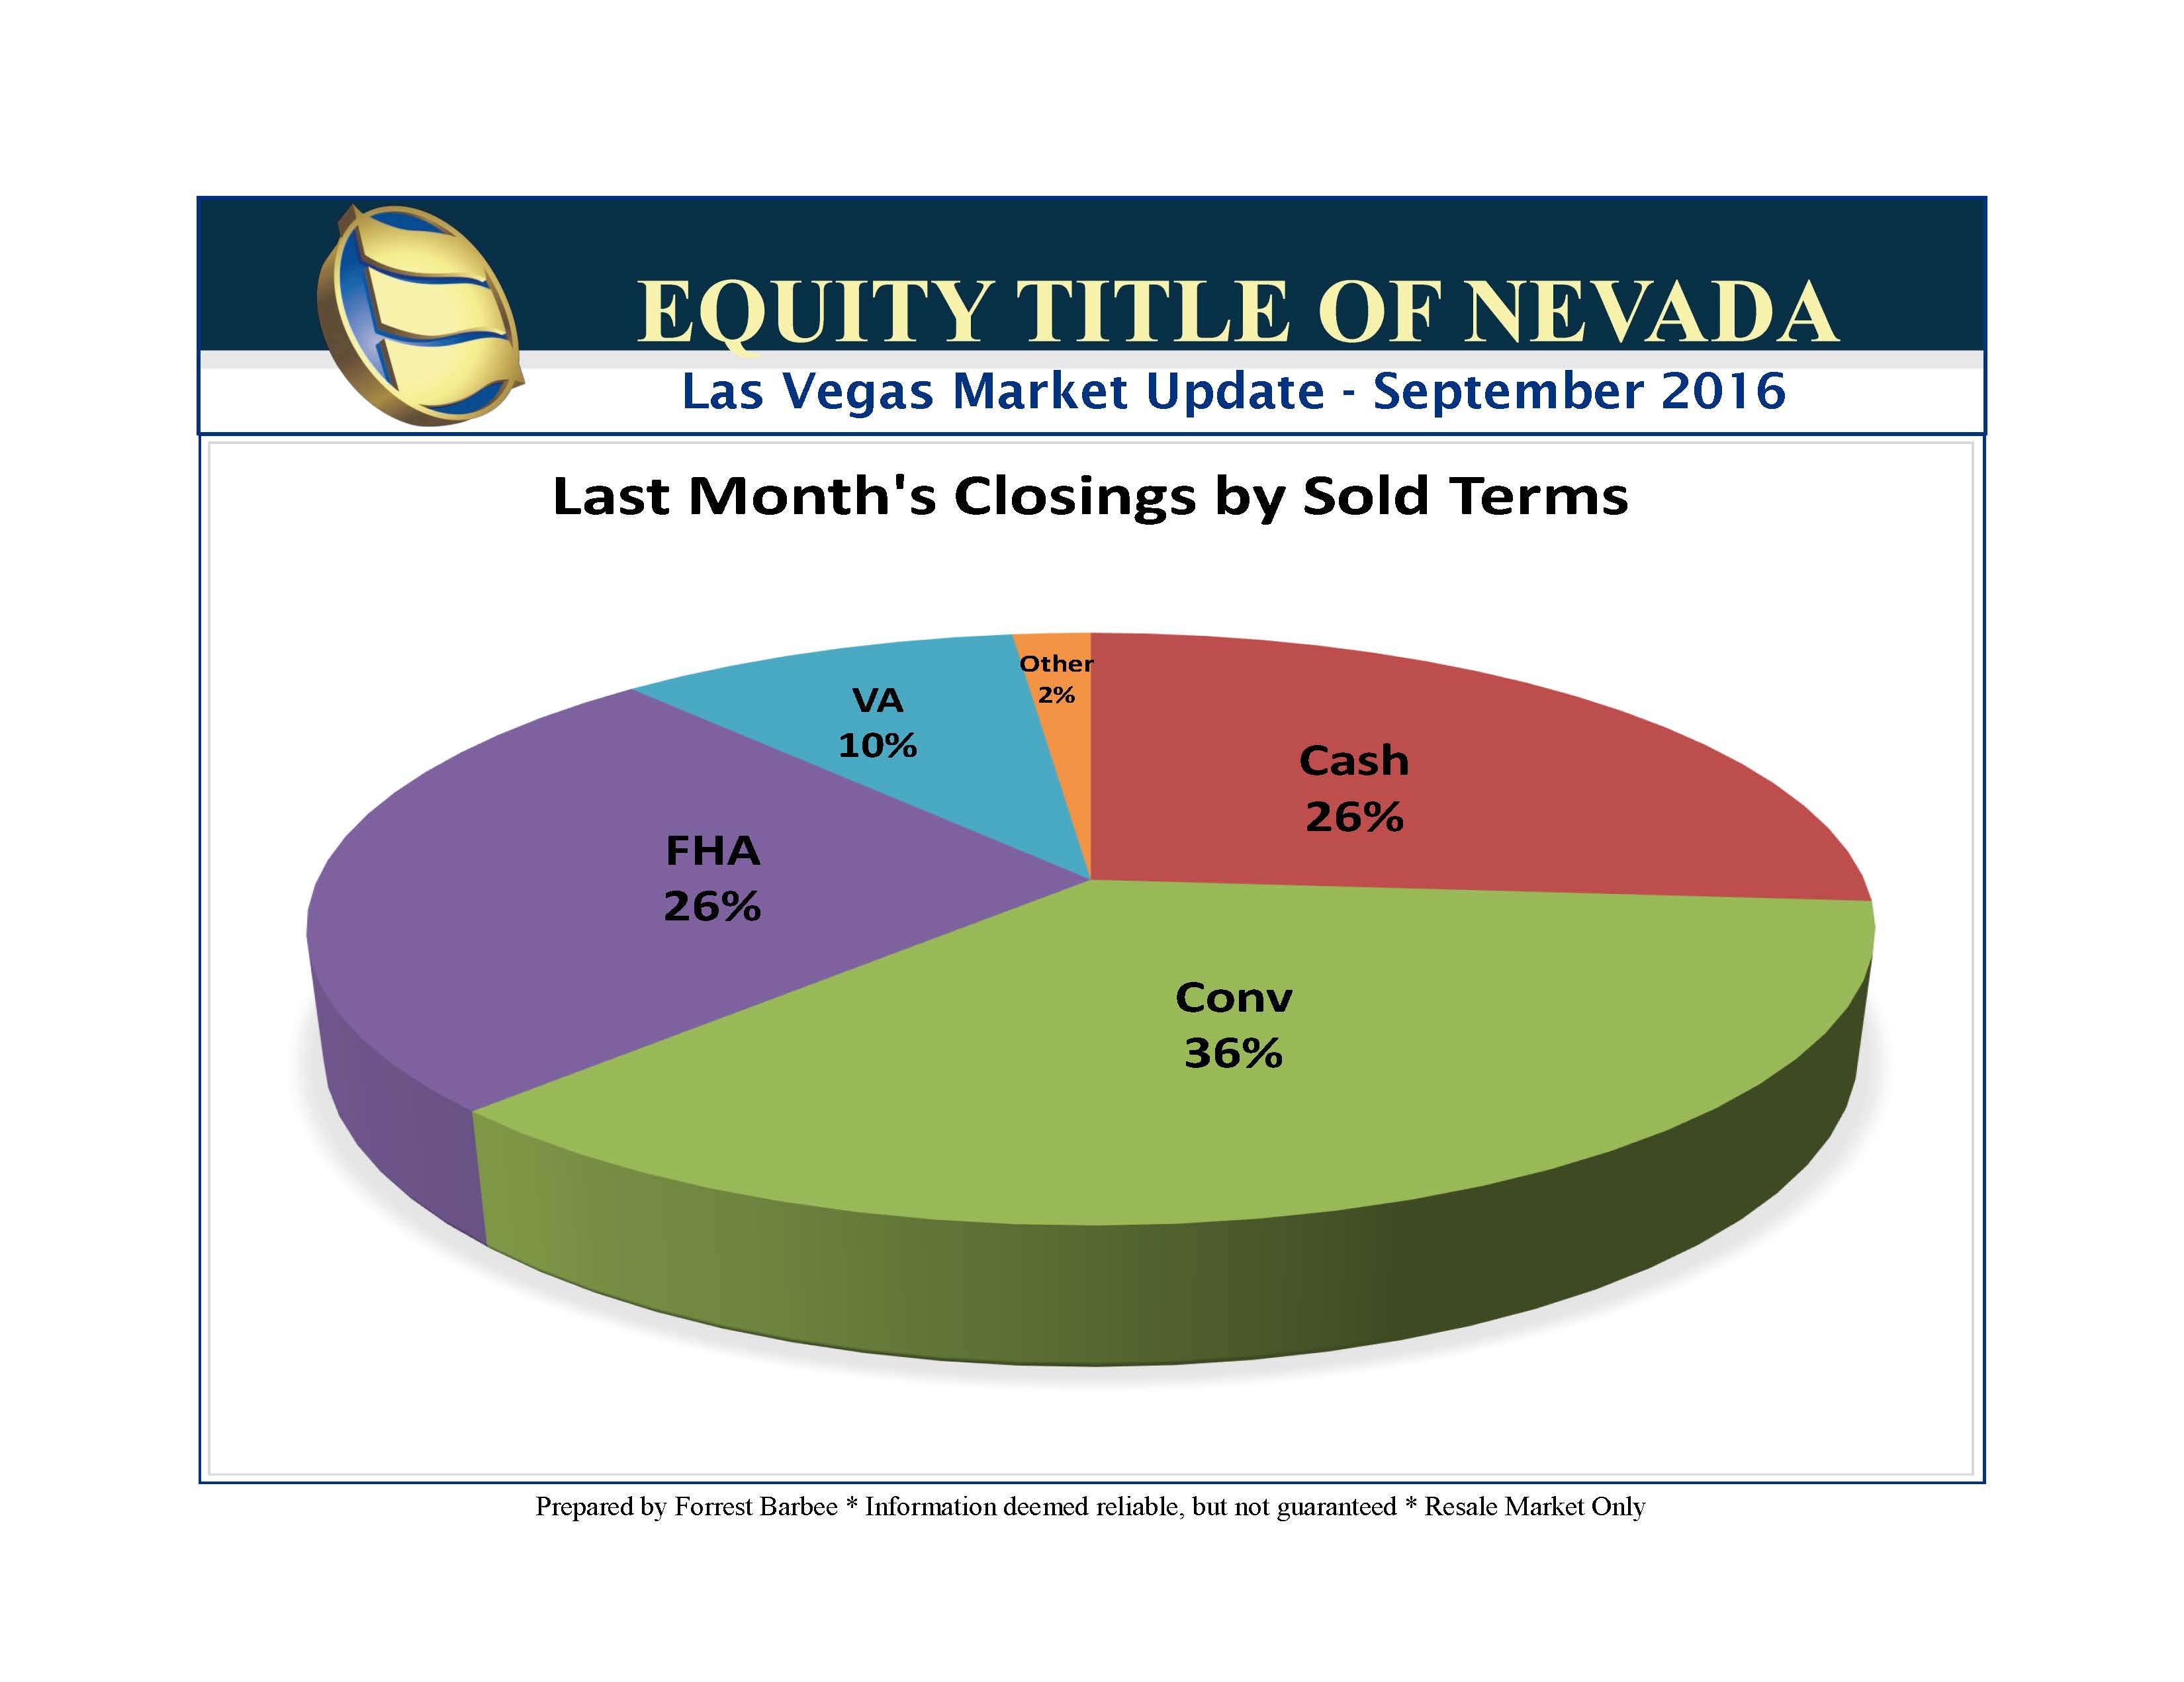
We have mentioned in previous blog posts that the Greater Las Vegas Real Estate Market continues to struggle more that many other markets with conventional financed transactions. The first chart below shows the Las Vegas market for all price points.
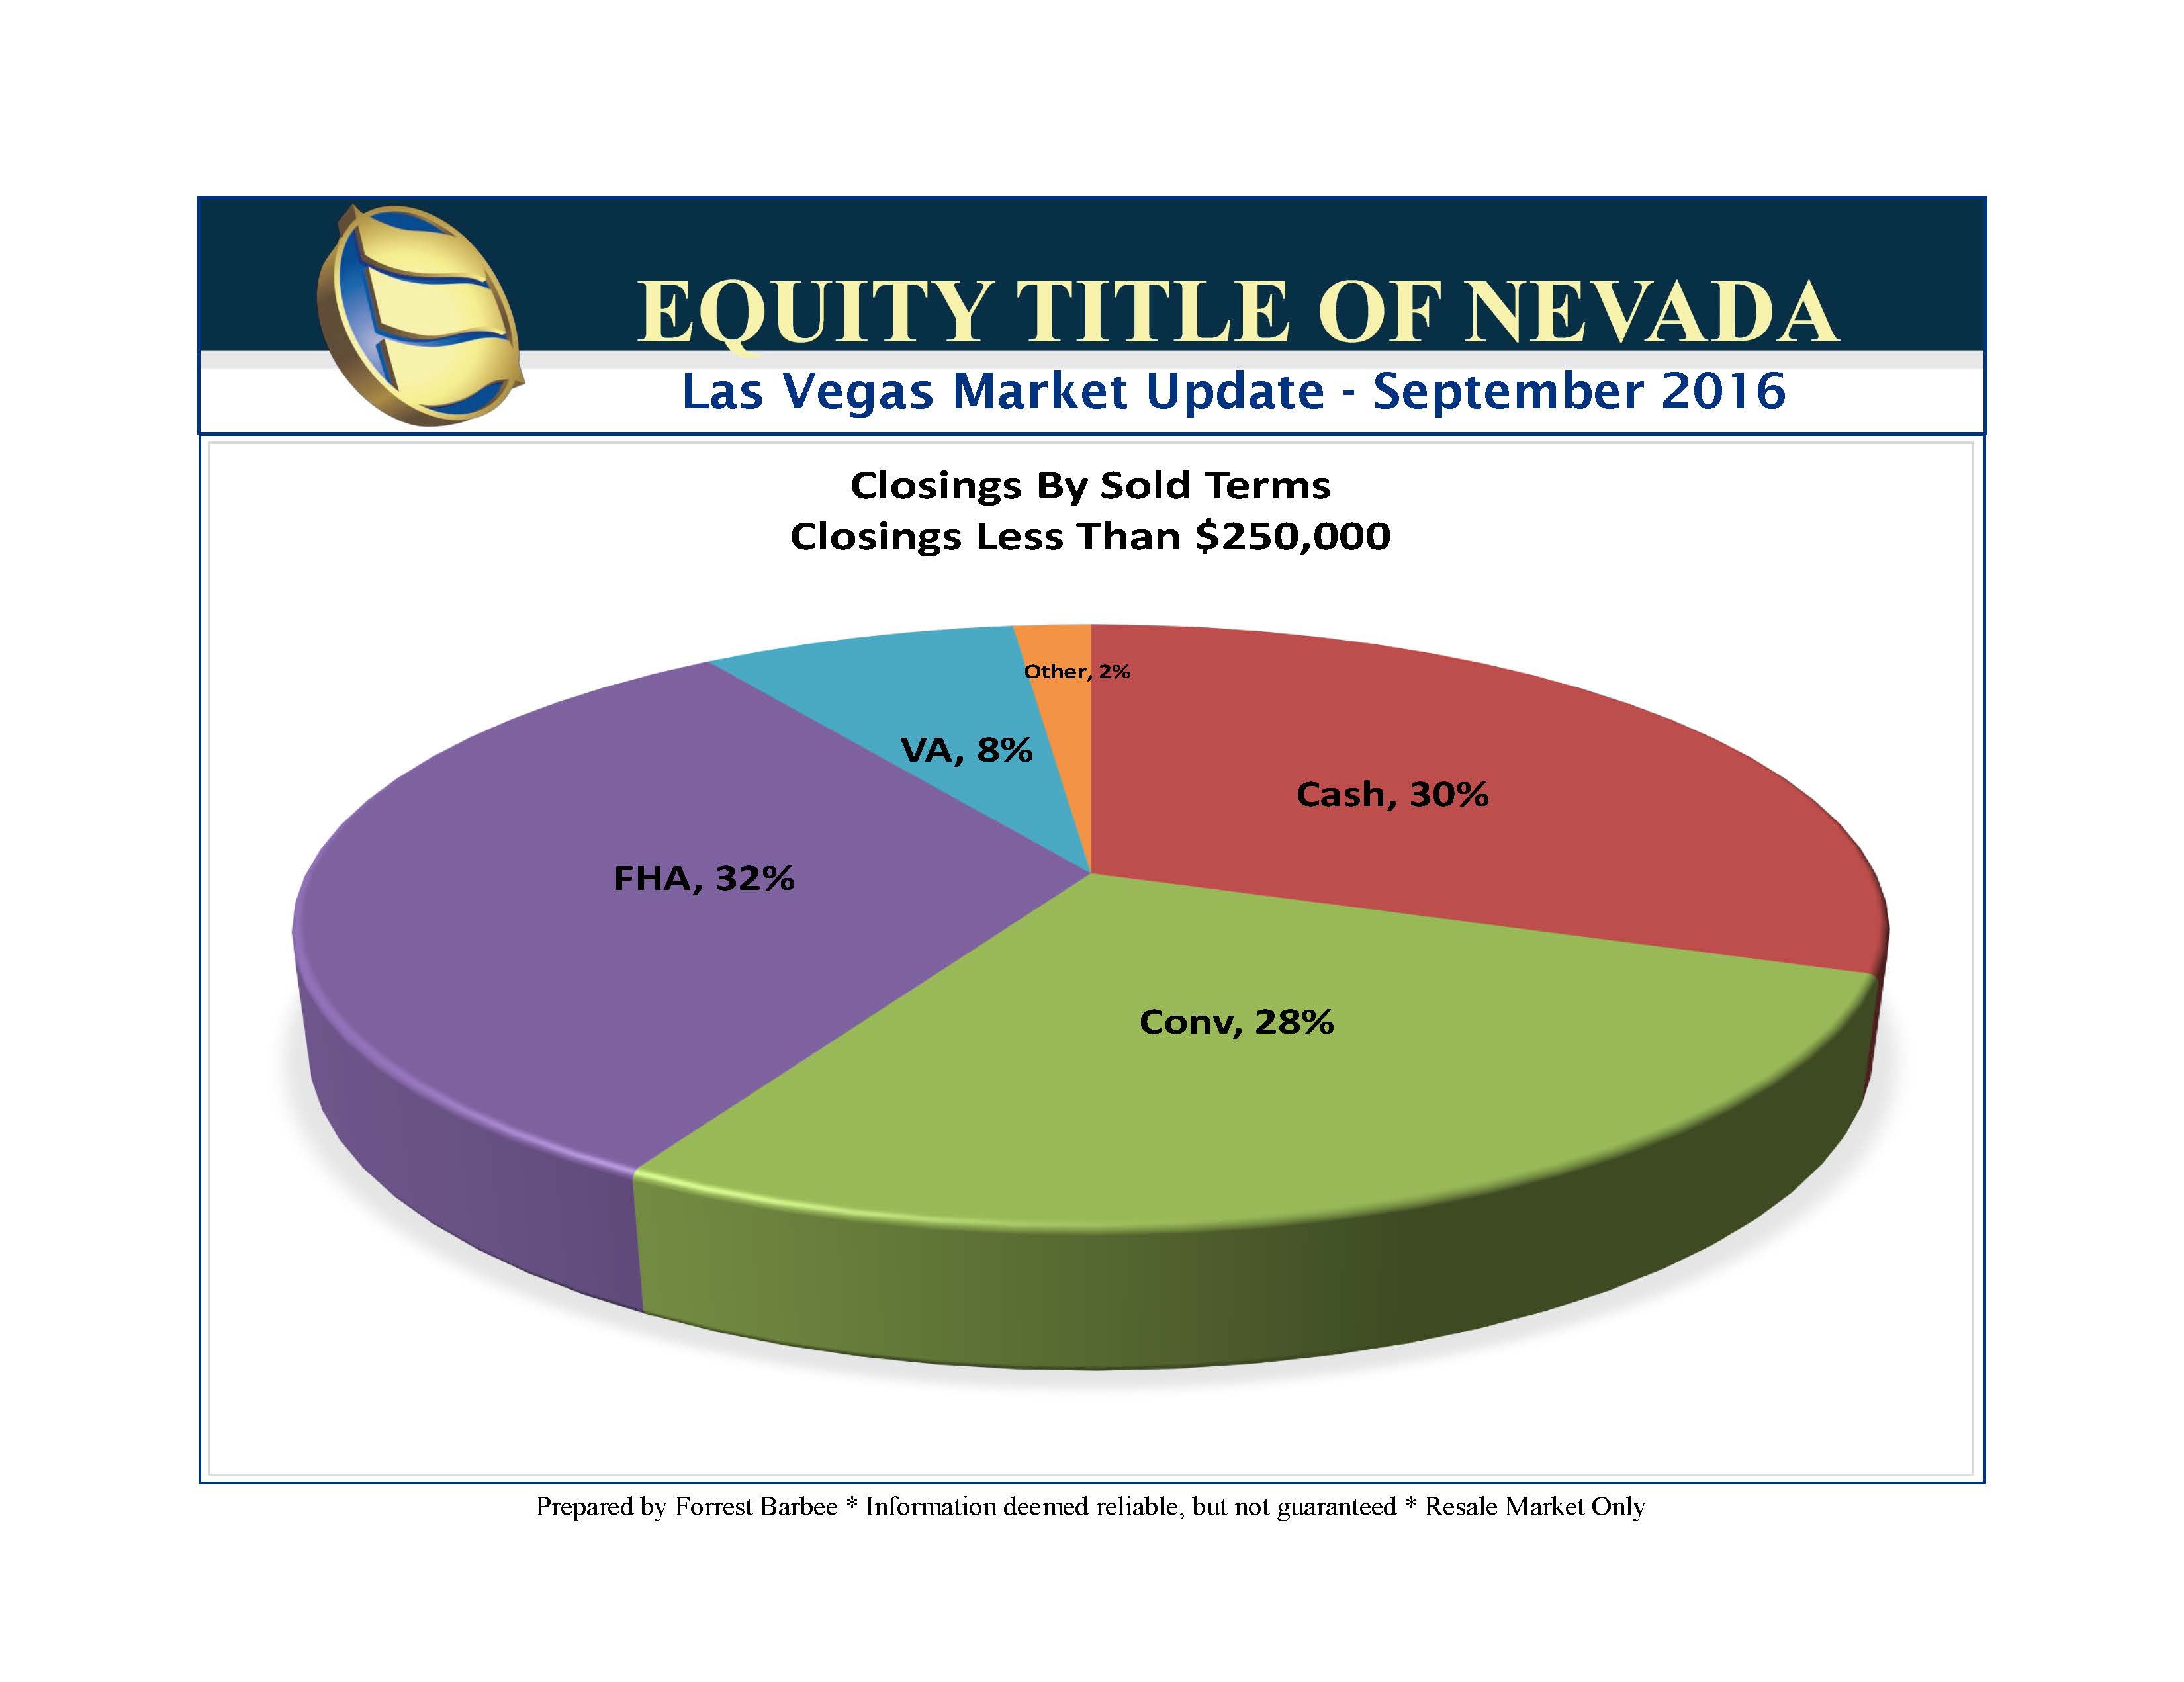
The next charts show the contrast between conventional financing below the $250,000 price point and then for the price range from $250,000 to $750,000.
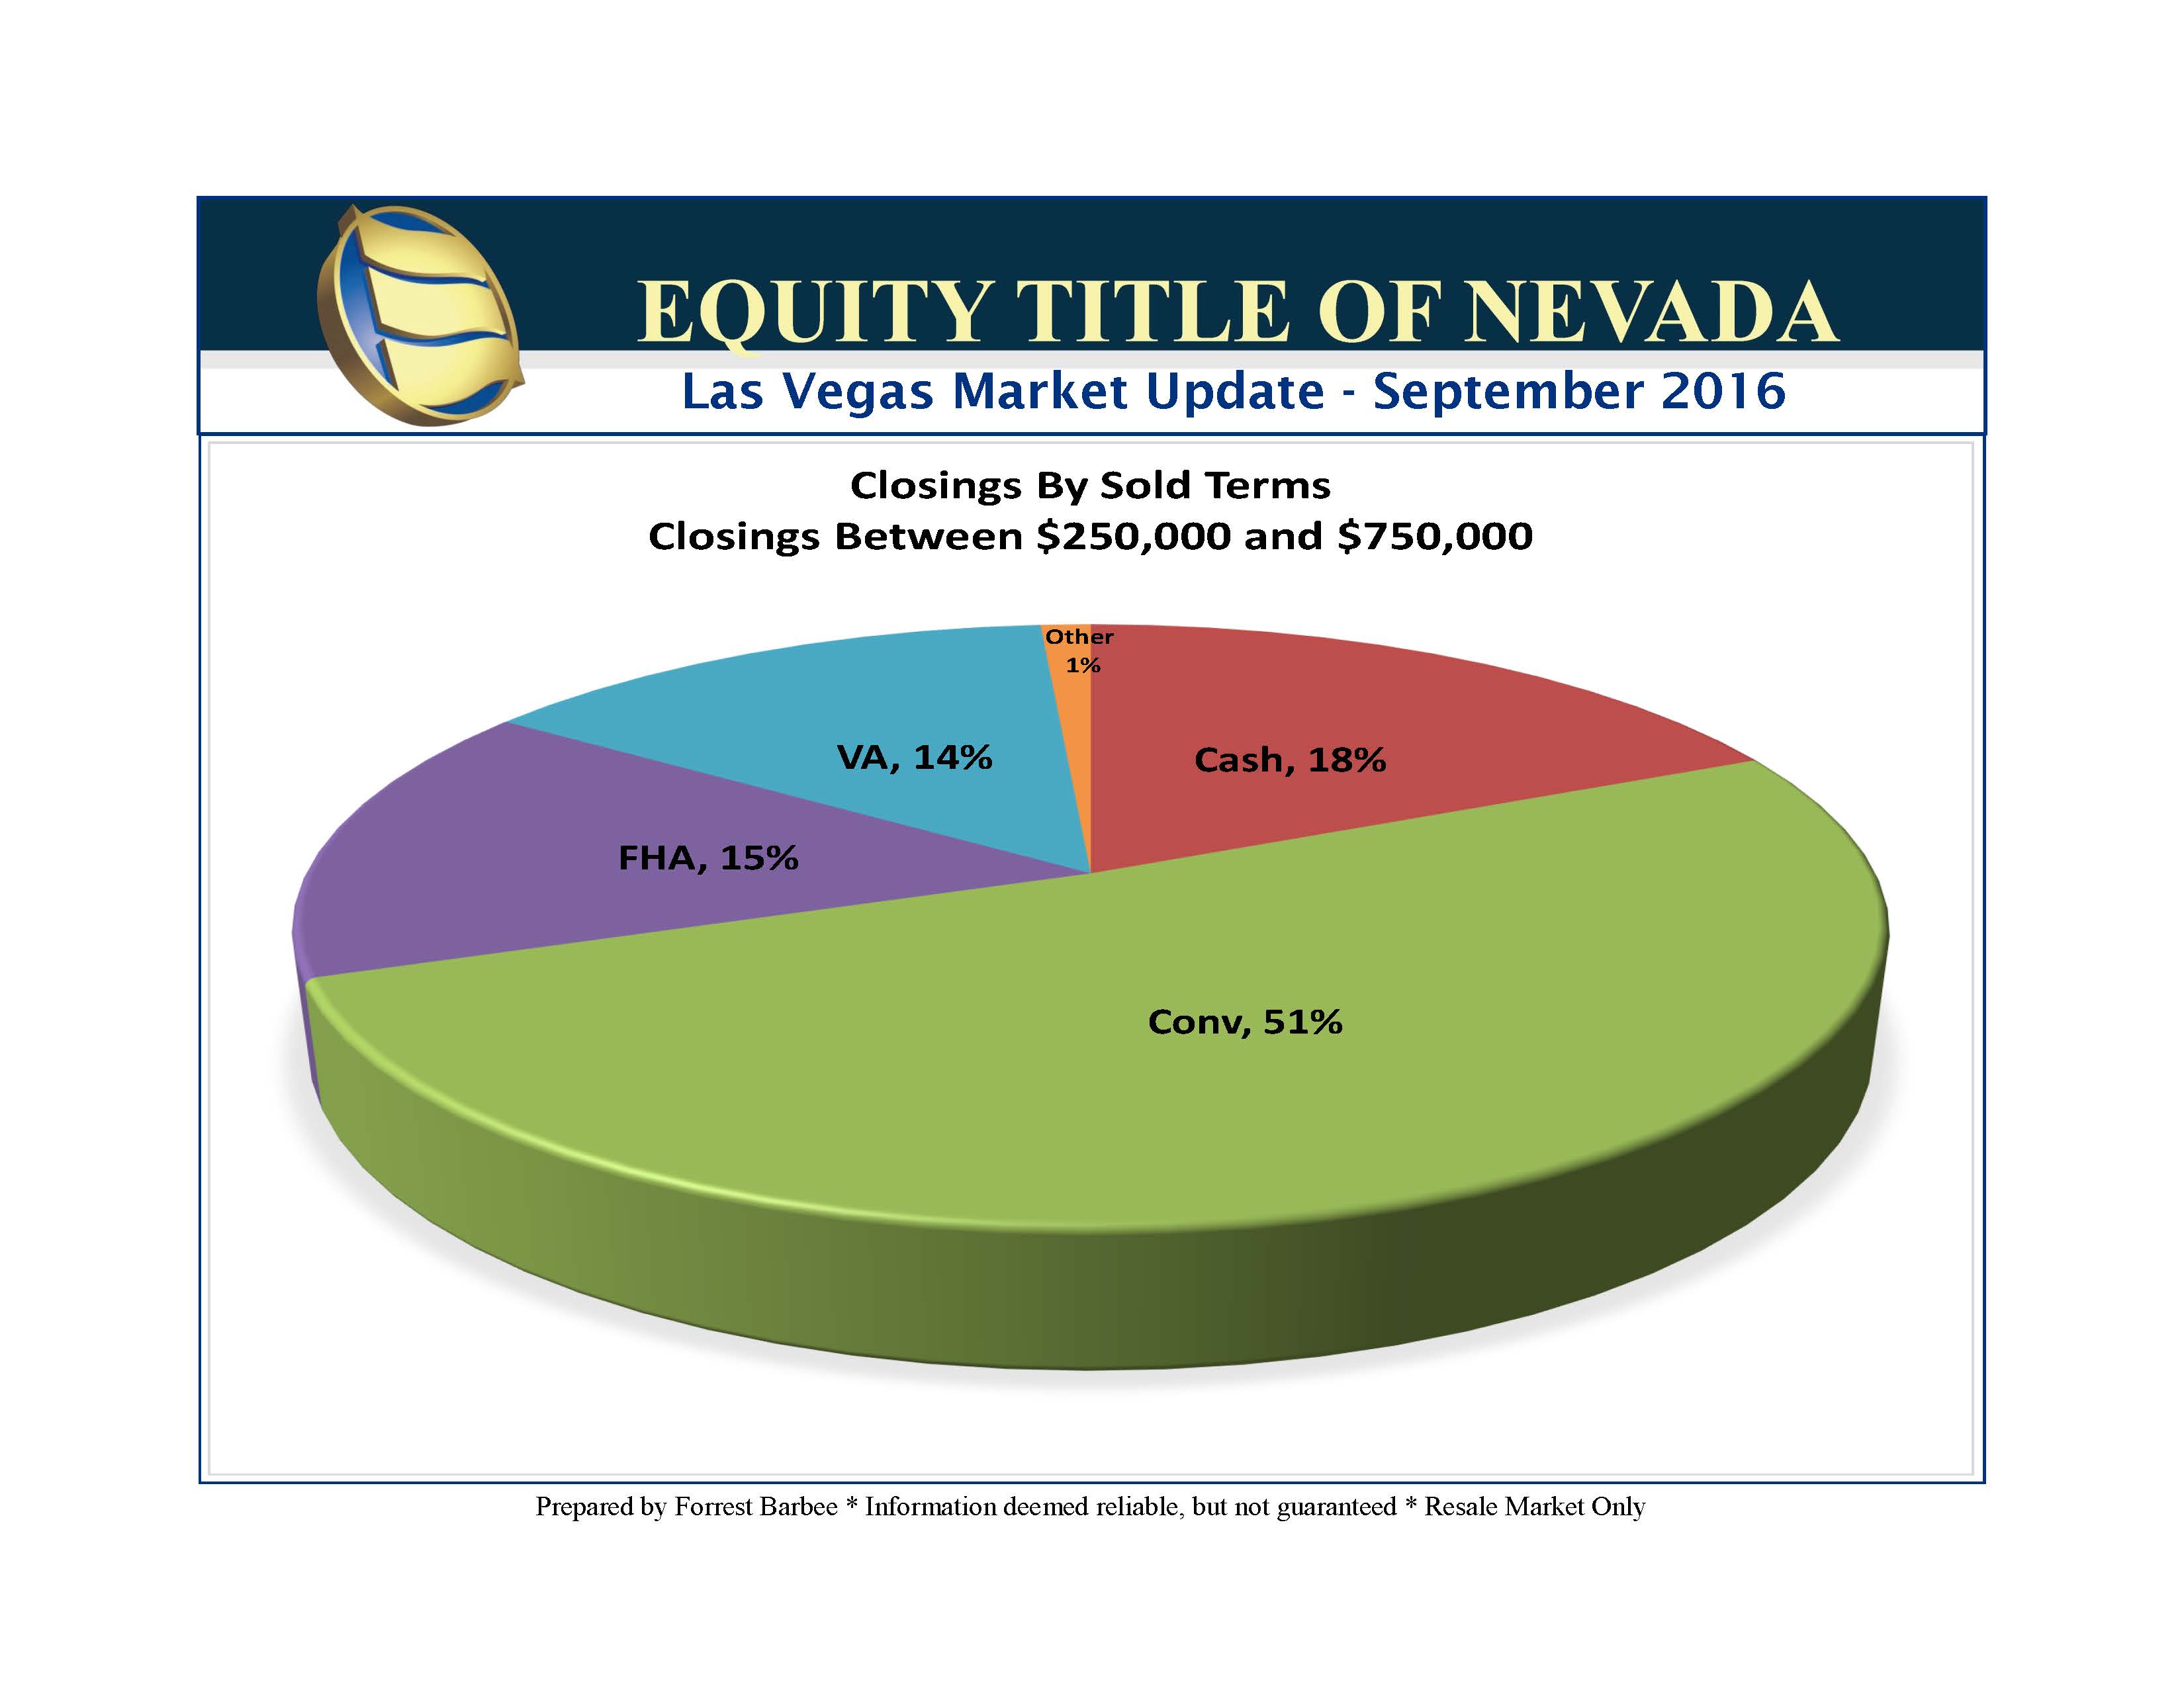
So which price points enjoy momentum in this market even as other price points are flat or falling? Here they are:


So the price ranges from $250,000 to $750,000 are the clear winners. Have you “Moved Your Cheese” yet and adapted to these market changes?
Have a Safe and Happy Labor Day!
