Why Homeownership Needs a Trump Presidency!

Lawrence Yun is Chief Economist and Senior Vice President of Research at the NATIONAL ASSOCIATION OF REALTORS® (NAR). He recently contributed an article and opinion in Forbes titled: “How Trump’s Presidency Could Impact Real Estate”. The challenges and opportunities that the Trump administration will face are clearly articulated in this article. This is a “must read” for anyone with an interest in ensuring that hard working Americans regain the opportunity to achieve the American Dream of homeownership. The past eight years has placed that Dream out of reach for far too many!
Click here to read the Lawrence Yun article that appeared in Forbes last month!
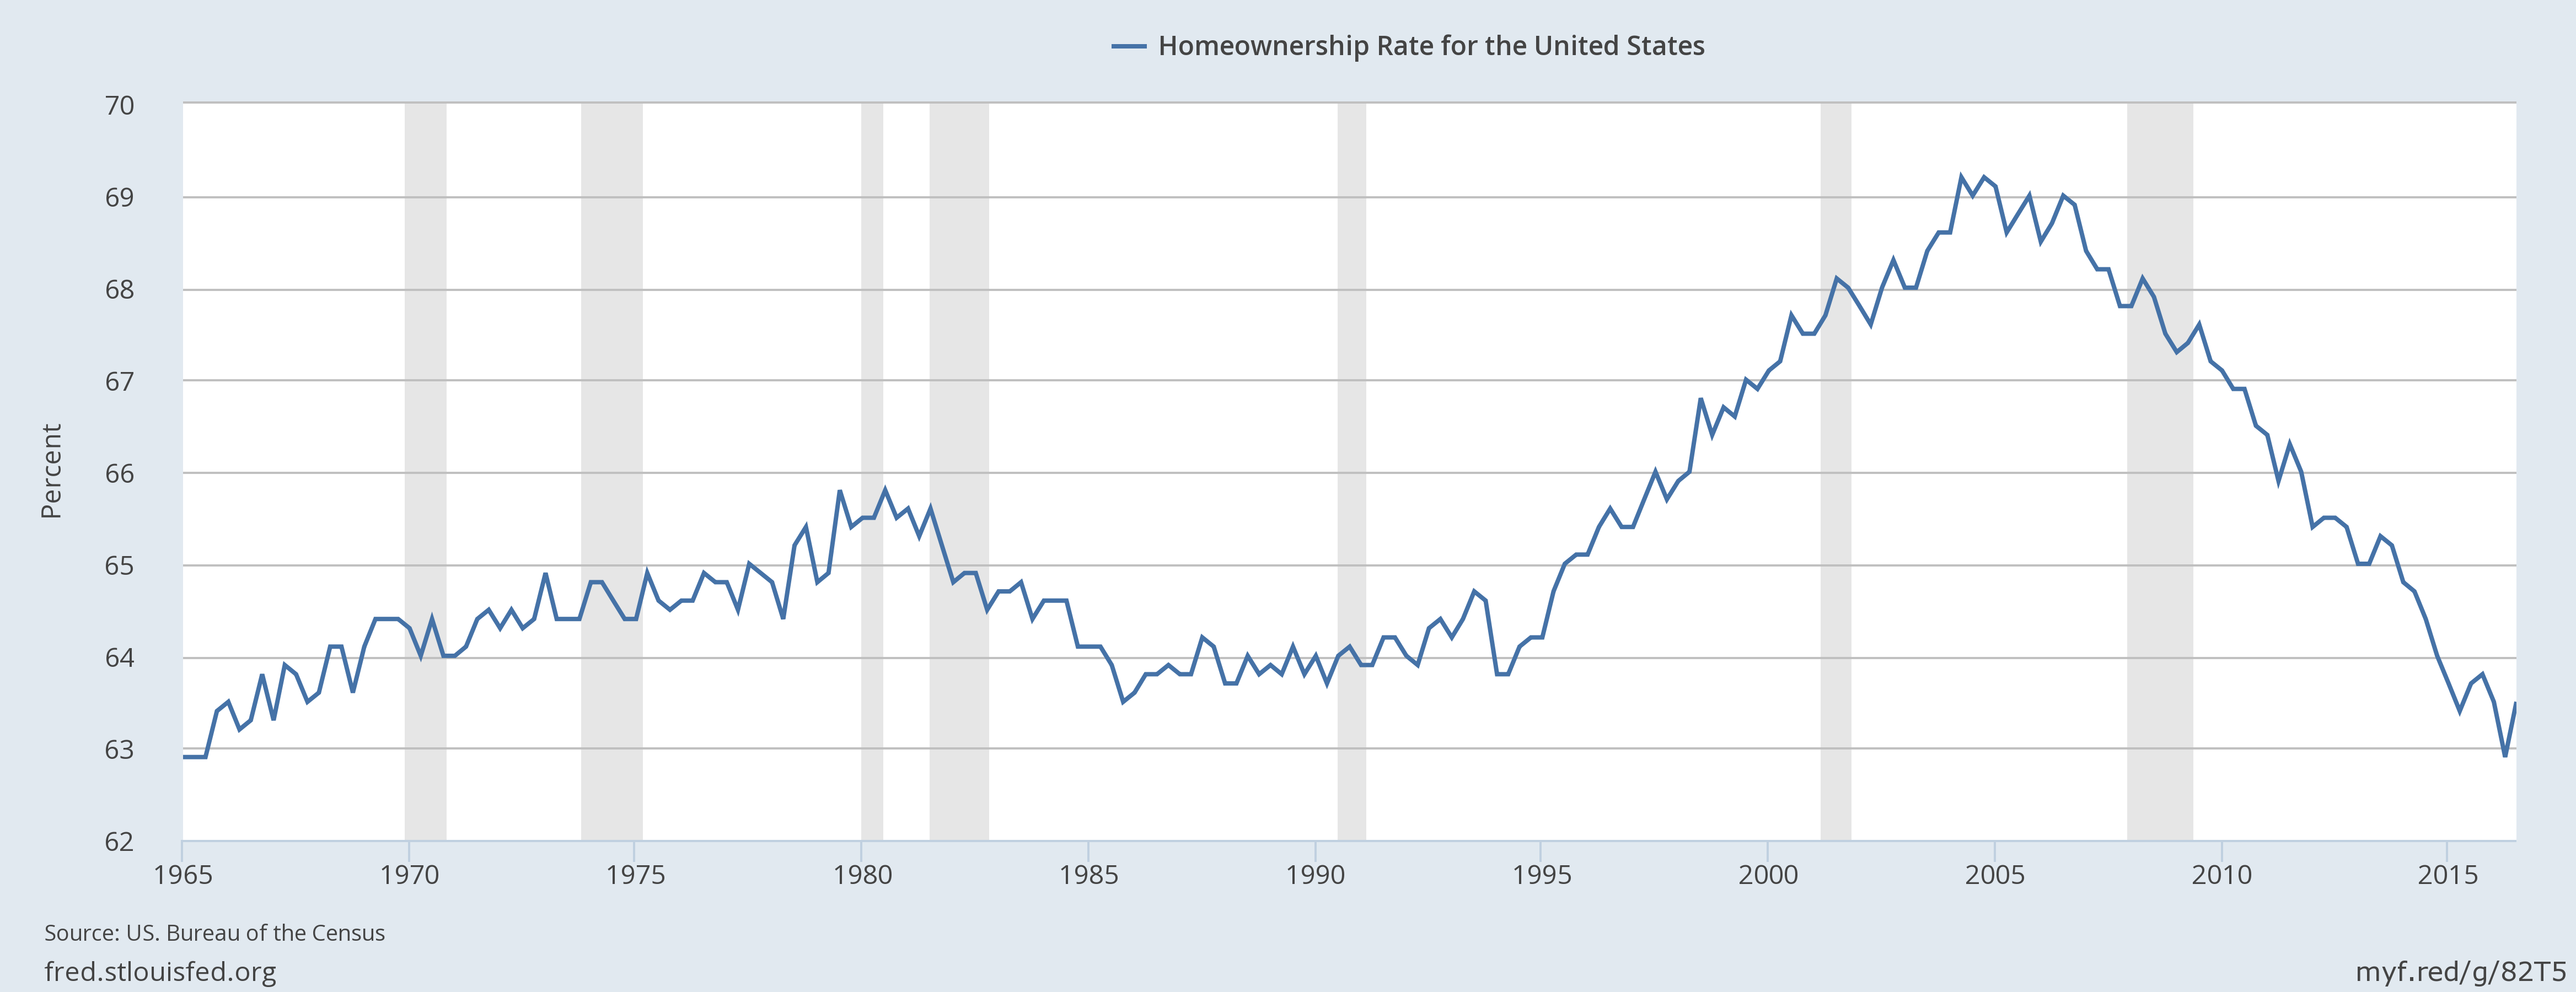
NAR recently reported that the rate of homeownership was at its lowest rate since 1965 as depicted in the chart below provided by the Federal Reserve Bank of St. Louis. Of course, it may be worse than that as it does not appear that there is any historical data earlier than 1965. How ironic is it that we are experiencing the lowest interest rates in our lifetime and that has only resulted in lower rates of homeownership? We had a higher rate of ownership in 1979-1980 when interest rates were 18-21% and when it would have been cheaper to buy a home on your American Express card than by obtaining a bank loan. Oh, there was greater inflation then and appears to be little to none now. Really? Perhaps that’s what happens when the government removes food and energy from the CPI index?
Homeownership Rate for the United States
It seems that the rate of homeownership began this precipitous decline prior to the market peak of 2006 and before the bubble burst. How have hard working Americans been failed by governmental efforts to fix the broken economy of the past eight to ten years? Freddie and Fannie failed! HVCC, MHA, HAMP, HARP, TRID, and Dodd-Frank efforts have all failed to improve homeownership rates. The creation of, flawed structure and implementation of the CFPB have only exacerbated those previous failures. Small banks are saddled with onerous compliance costs under Dodd-Frank while the “mega-banks” treat compliance costs and exorbitant fines as a cost of doing business. The result leaves the hard working American consumer being punished for the financial sins of failed systems, legislation, governmental institutions and quasi-governmental institutions.
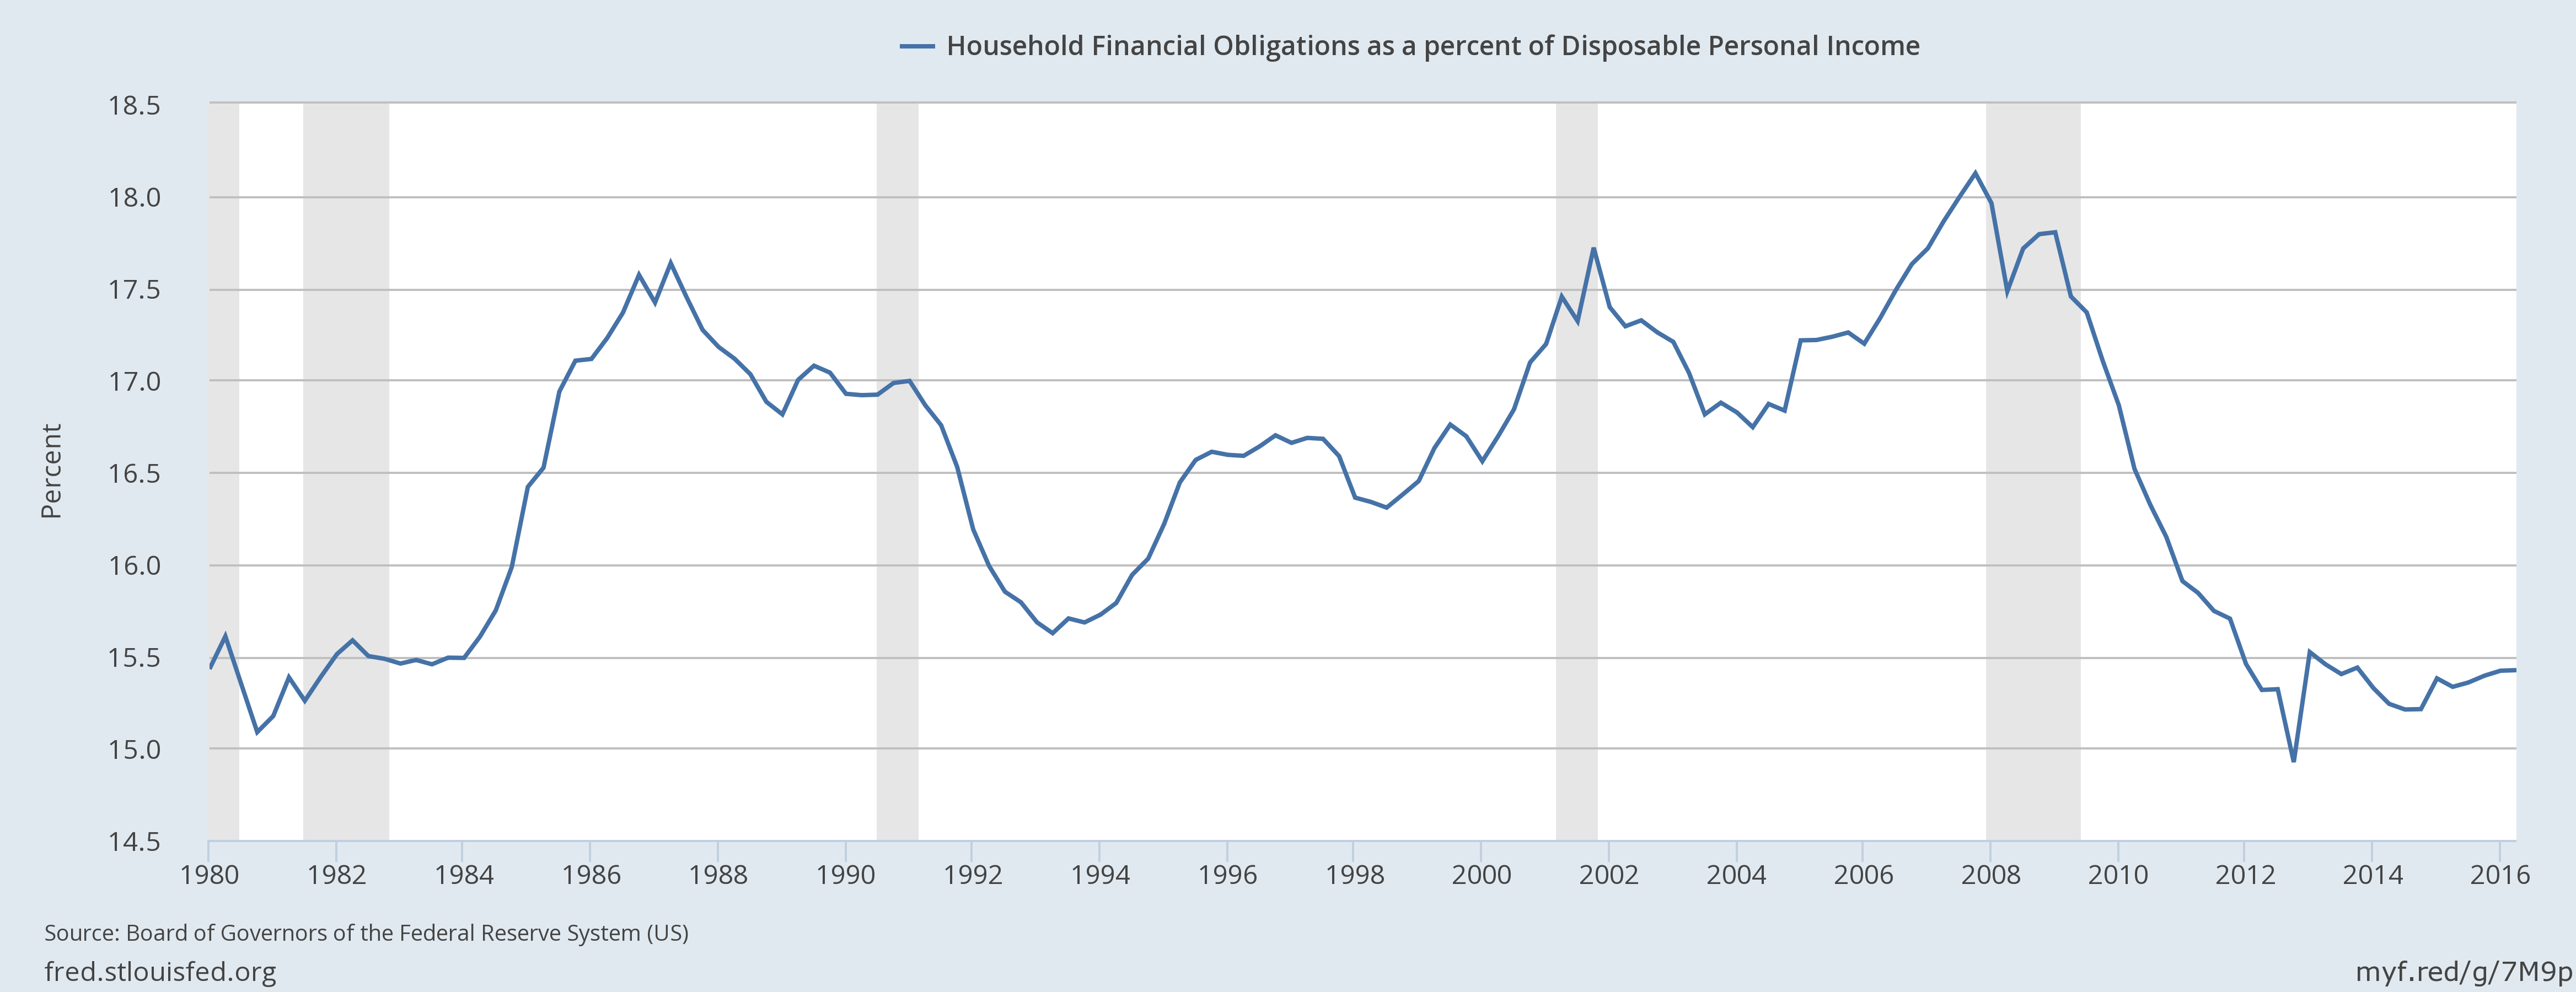
The two charts below show just how tight credit has become and reflects the challenges of requiring higher and higher FICO scores to obtain a loan today compared to eight years ago. Credit is as tight now as when we were faced with 18% interest rates! How is that even possible? No one wants to return to the days of consumers being able to falsify incomes and only having to “fog a mirror” to obtain a loan. Yet credit has been tightened to the point where there is virtually no risk for the lenders today. Both scenarios are patently wrongheaded! It’s time to bet on hard working Americans rather than the failed systems that got us here in the first place. We sorely need to move from a fragile economic recovery to a robust, sustainable recovery that puts people back to work with good wages, salaries, and better economic opportunities.
Mortgage Debt Service Payments as a Percent of Disposable Personal Income
Household Financial Obligations as a Percent of Disposable Personal Income
We need a new administration and Congress that can begin to turn this around as badly as we did when President Reagan took office in 1981! We need to critically reform or “nuke” legislation, systems, and agencies that have contributed to the demise of homeownership rates in America this past eight years! I am confident that 2017 will be our 1981! So let’s fasten our seat belts for an exceptional year of real estate ahead!
Click Here for more Economic Research Charts from the Federal Reserve Bank of St. Louis!
Greater Las Vegas Market Overview
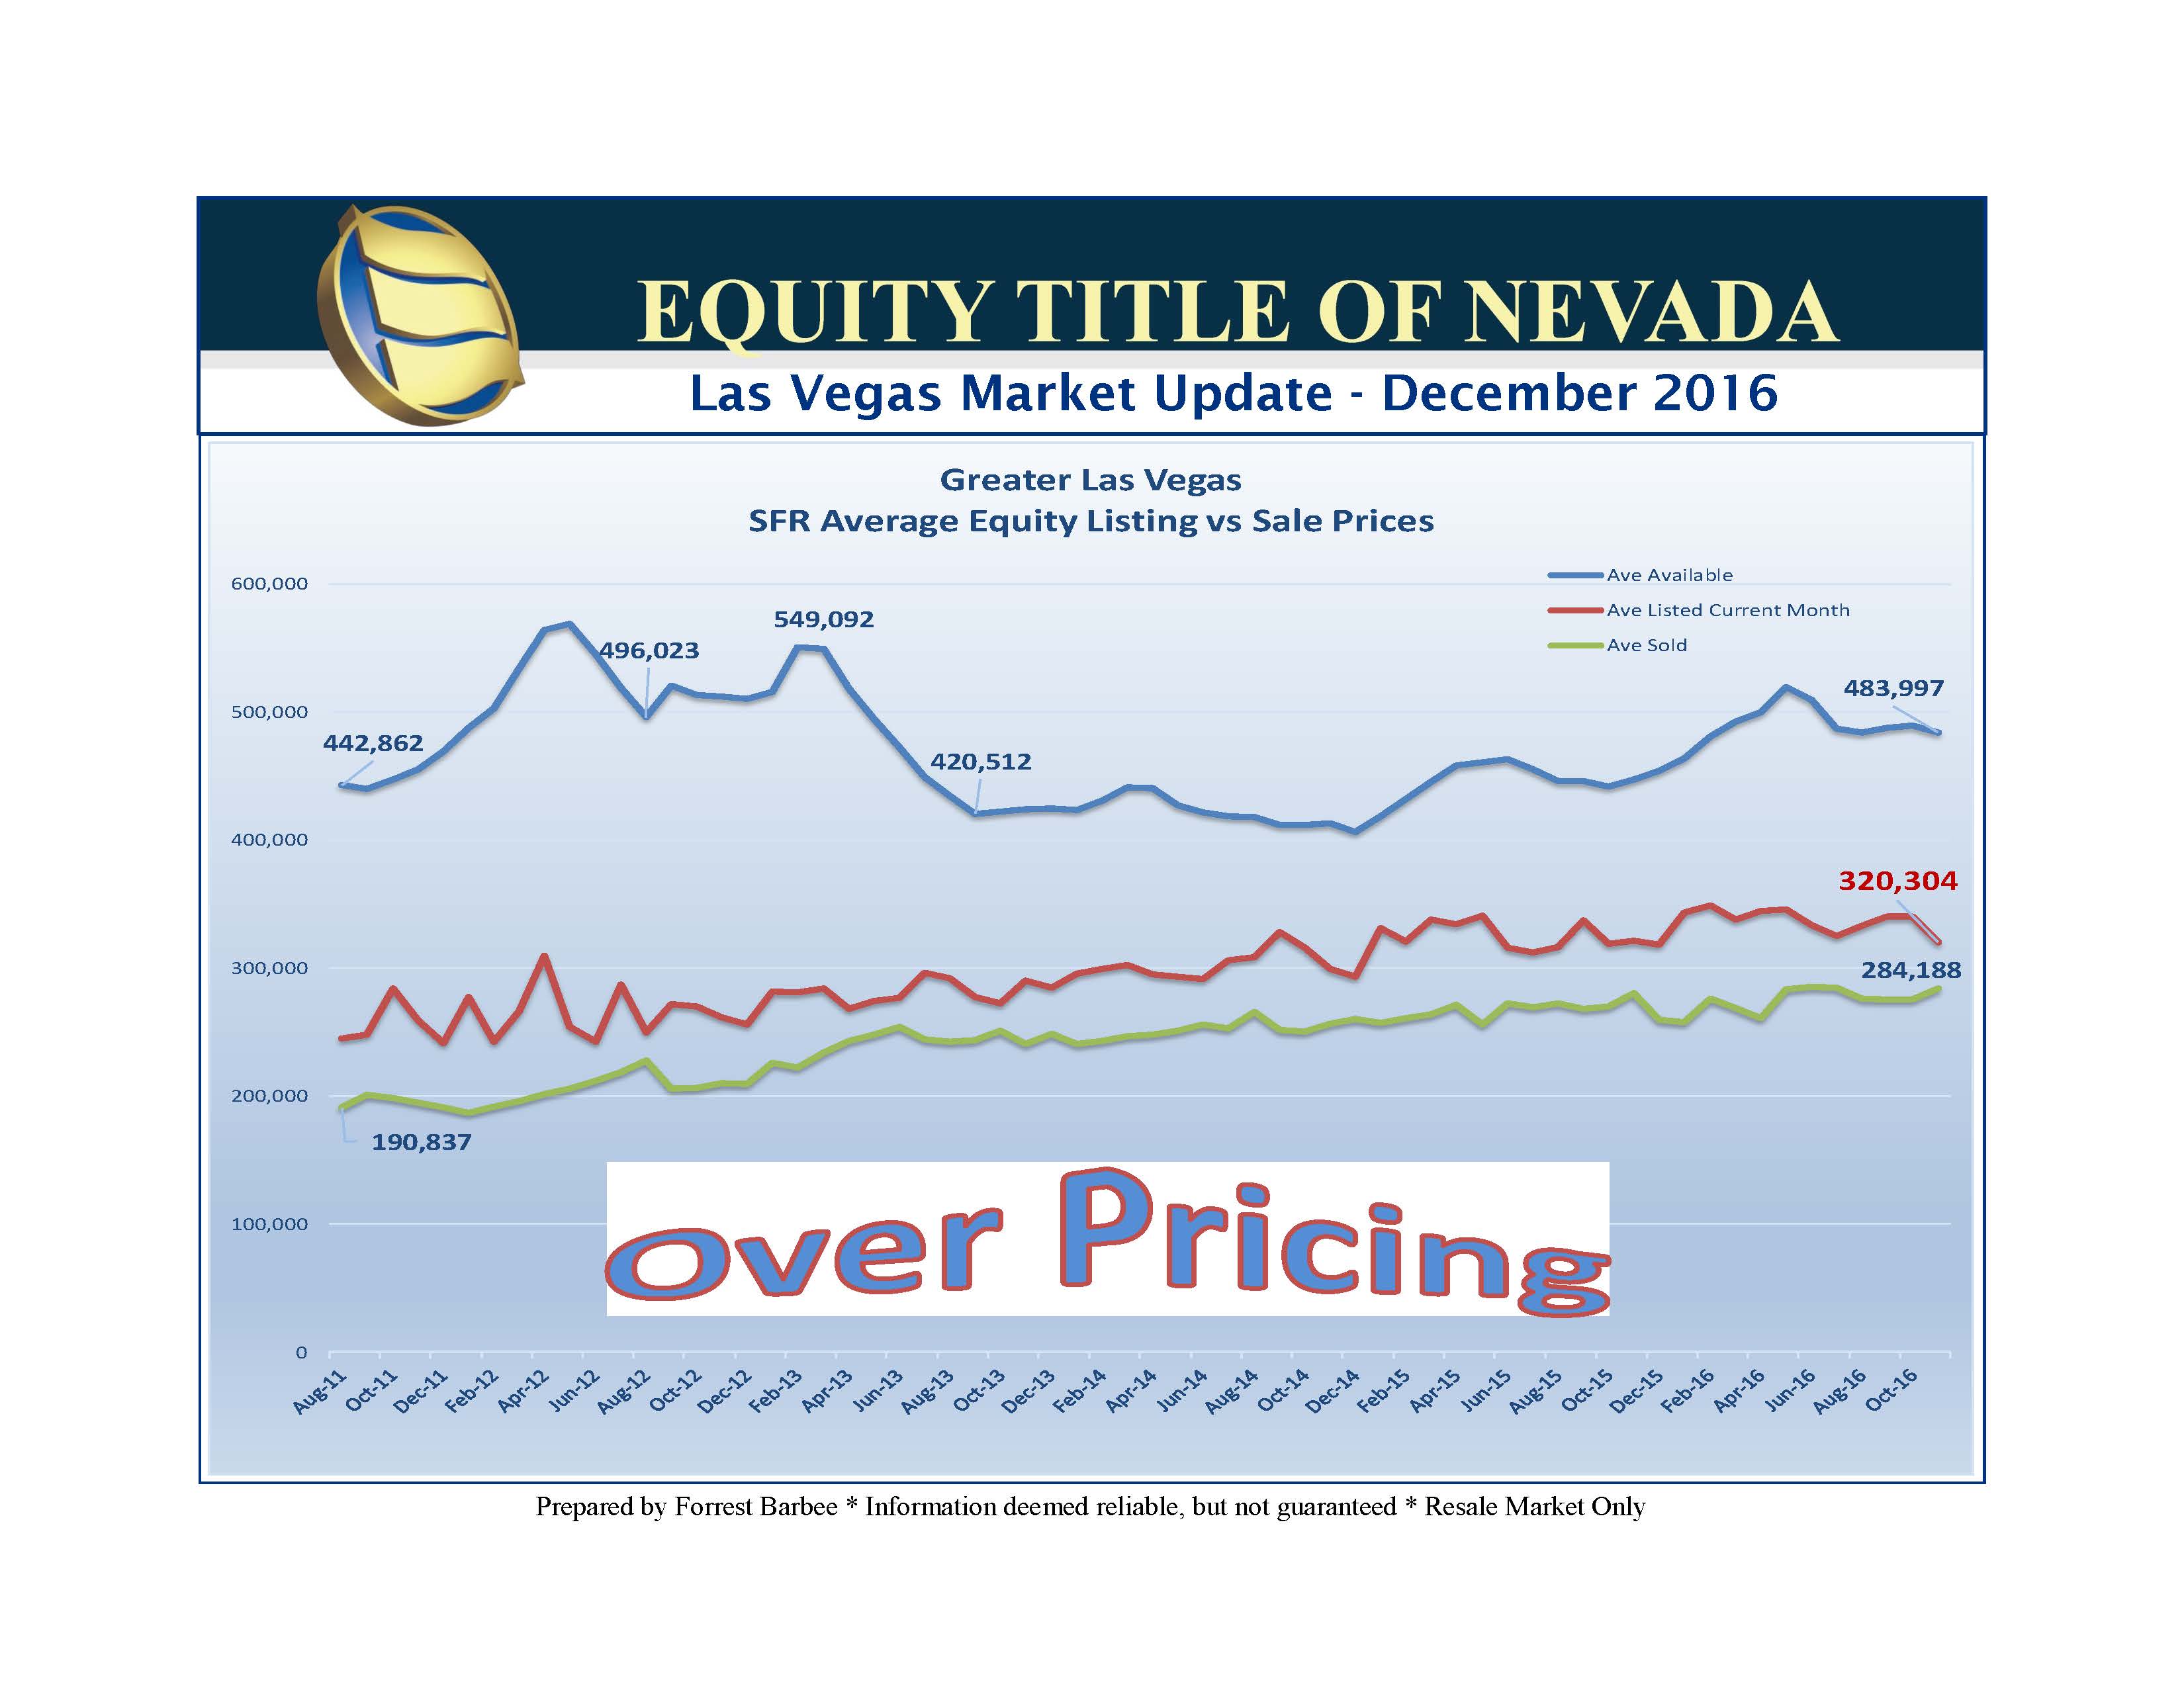
November Single Family Residential (SFR) closed sales were down only 1.1% from October but 31%higher than at this time last year. The median closed sales price of a SFR rose 3.5% to $240,000 while the average closed sales price of an SFR was improved by 4% at $278,254. Residential closed sales remain 6.6% better than at this time in 2015. Condo/Townhome sales are up 16.6% over 2015 while Hi-rise closings are up 10.2% compared to last year.

Click Here for the Current Market Update
Click Here for Additional Las Vegas Market Update Charts
The first chart shows that the average closing prices of and SFR have increased by 10% since December 2015 despite having trended sideways a great deal this year. However, check out the subdivision units and price trends charts to see which communities are down and which ones are up. Finally, the last chart shows that we have made some headway on correcting the over pricing that has permeated Las Vegas real estate market prices.