 Greater Las Vegas Real Estate Market Overview

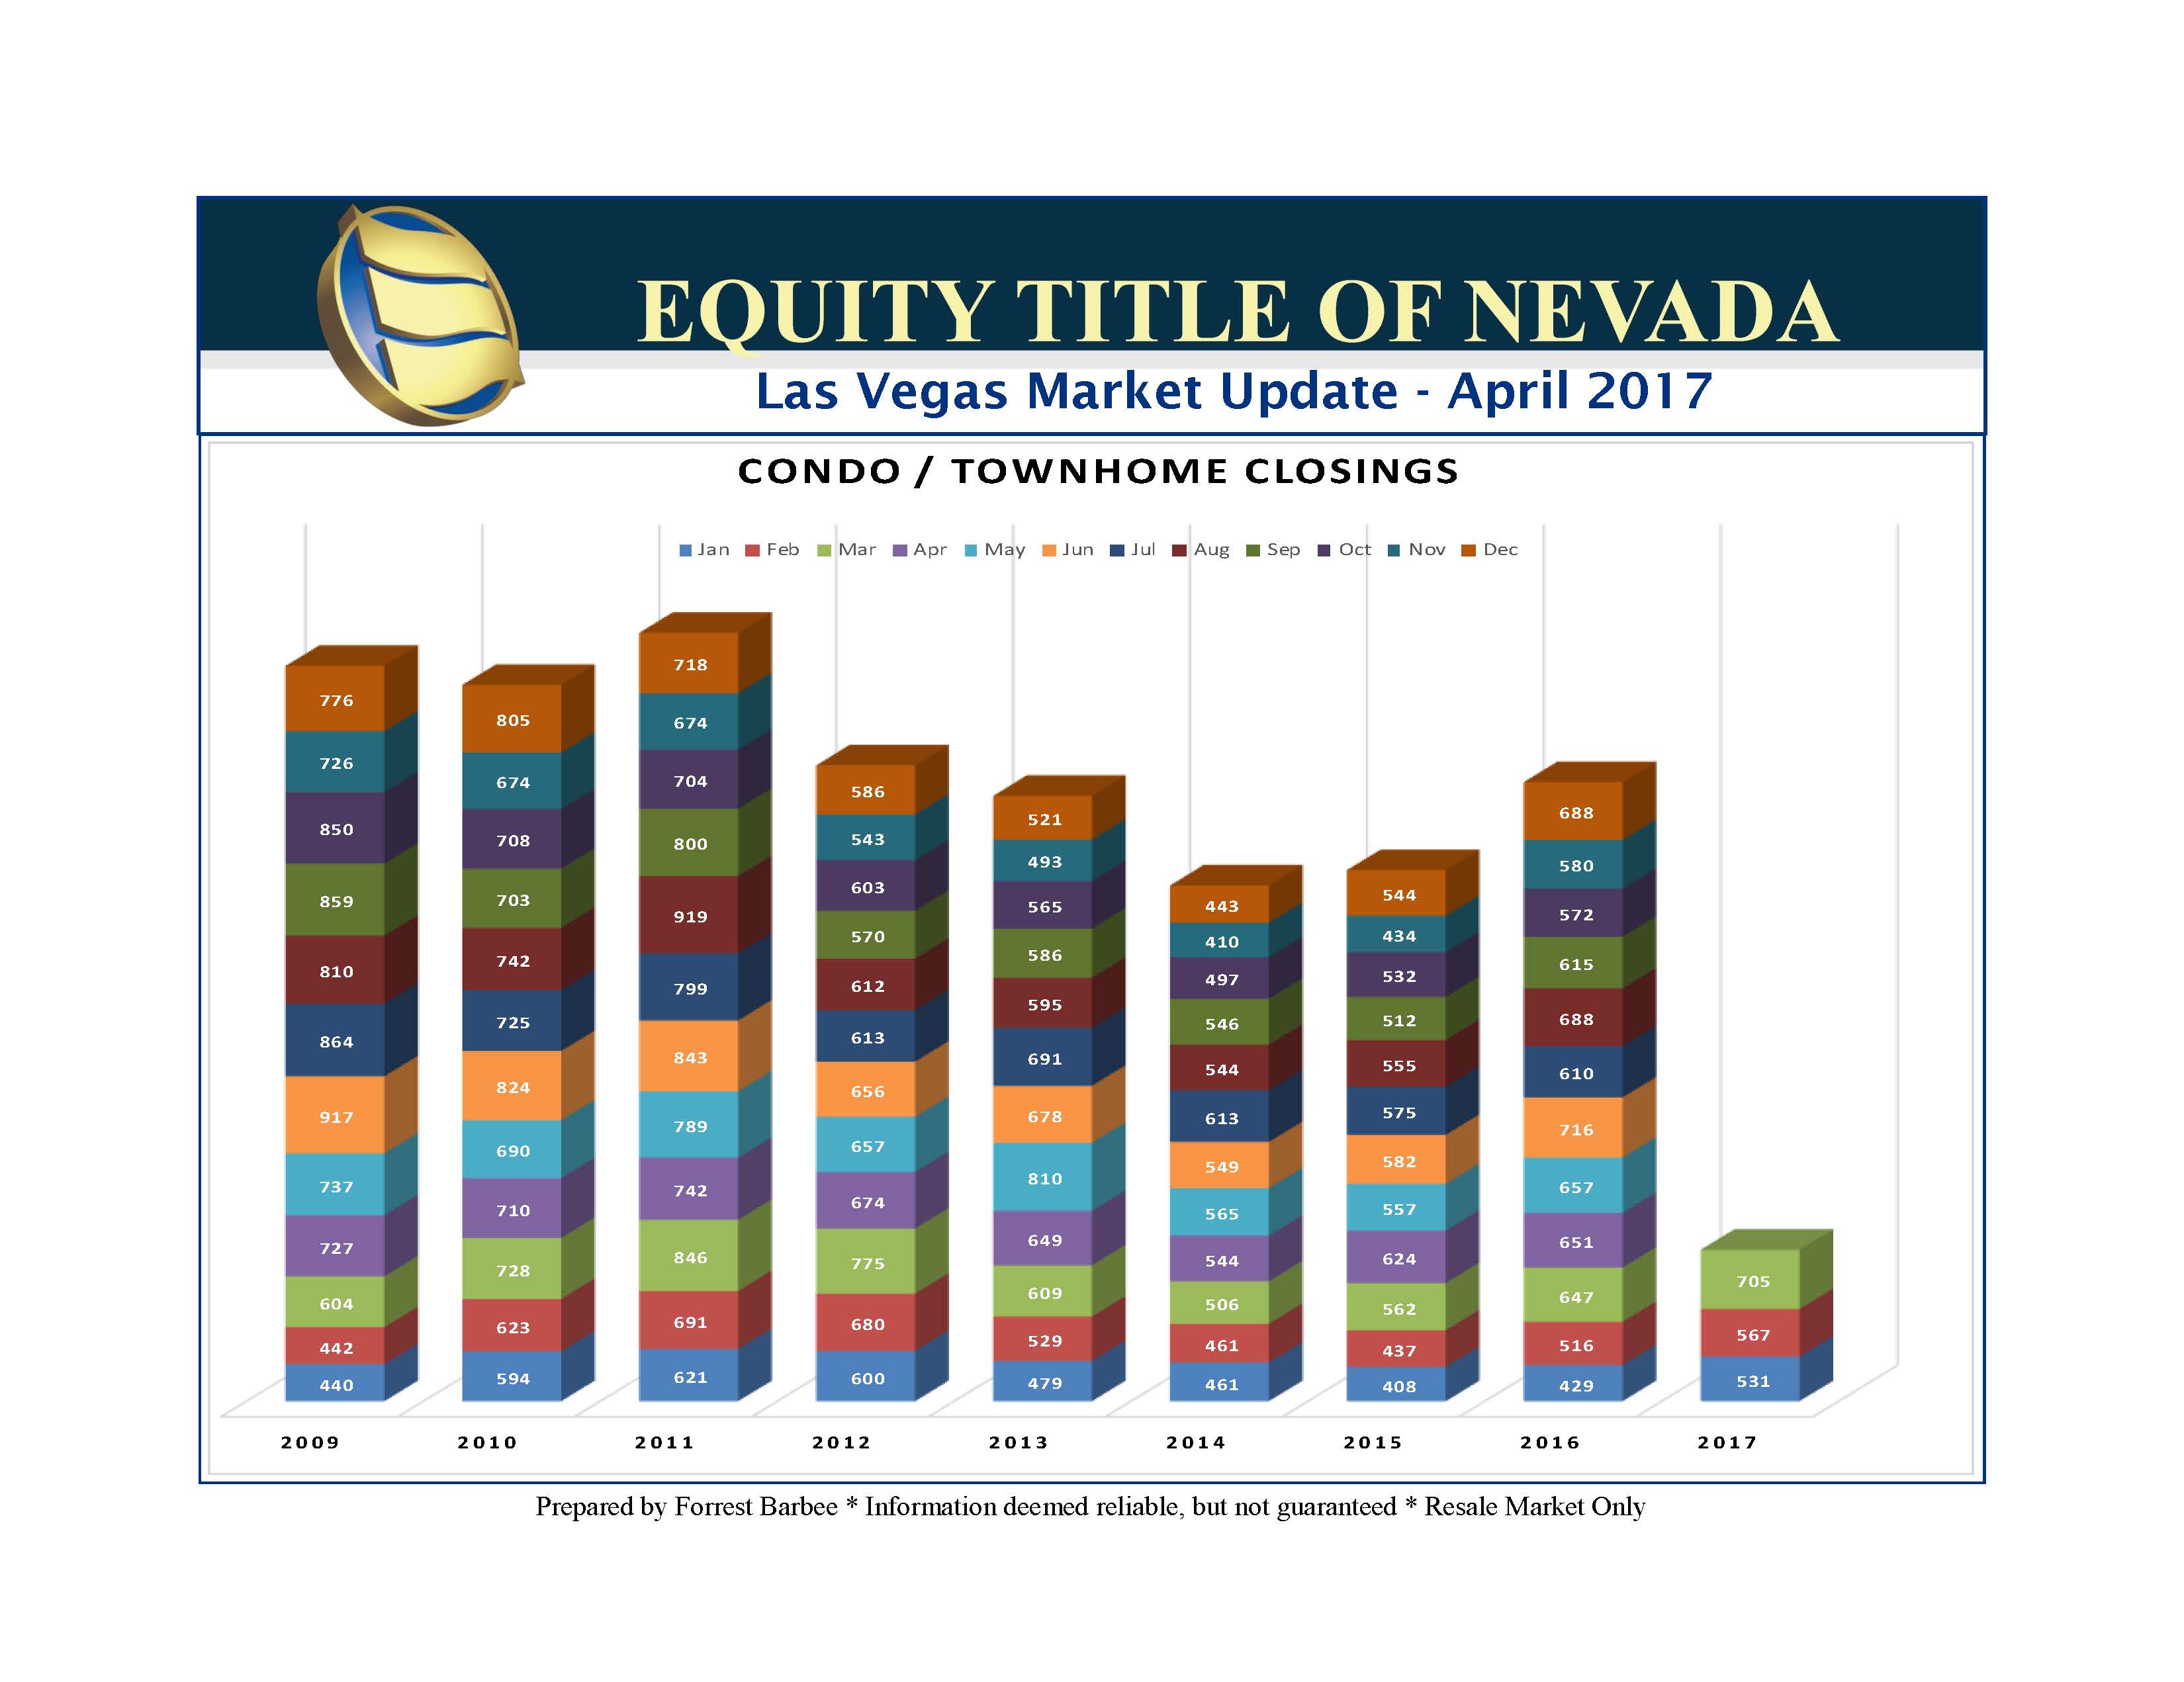
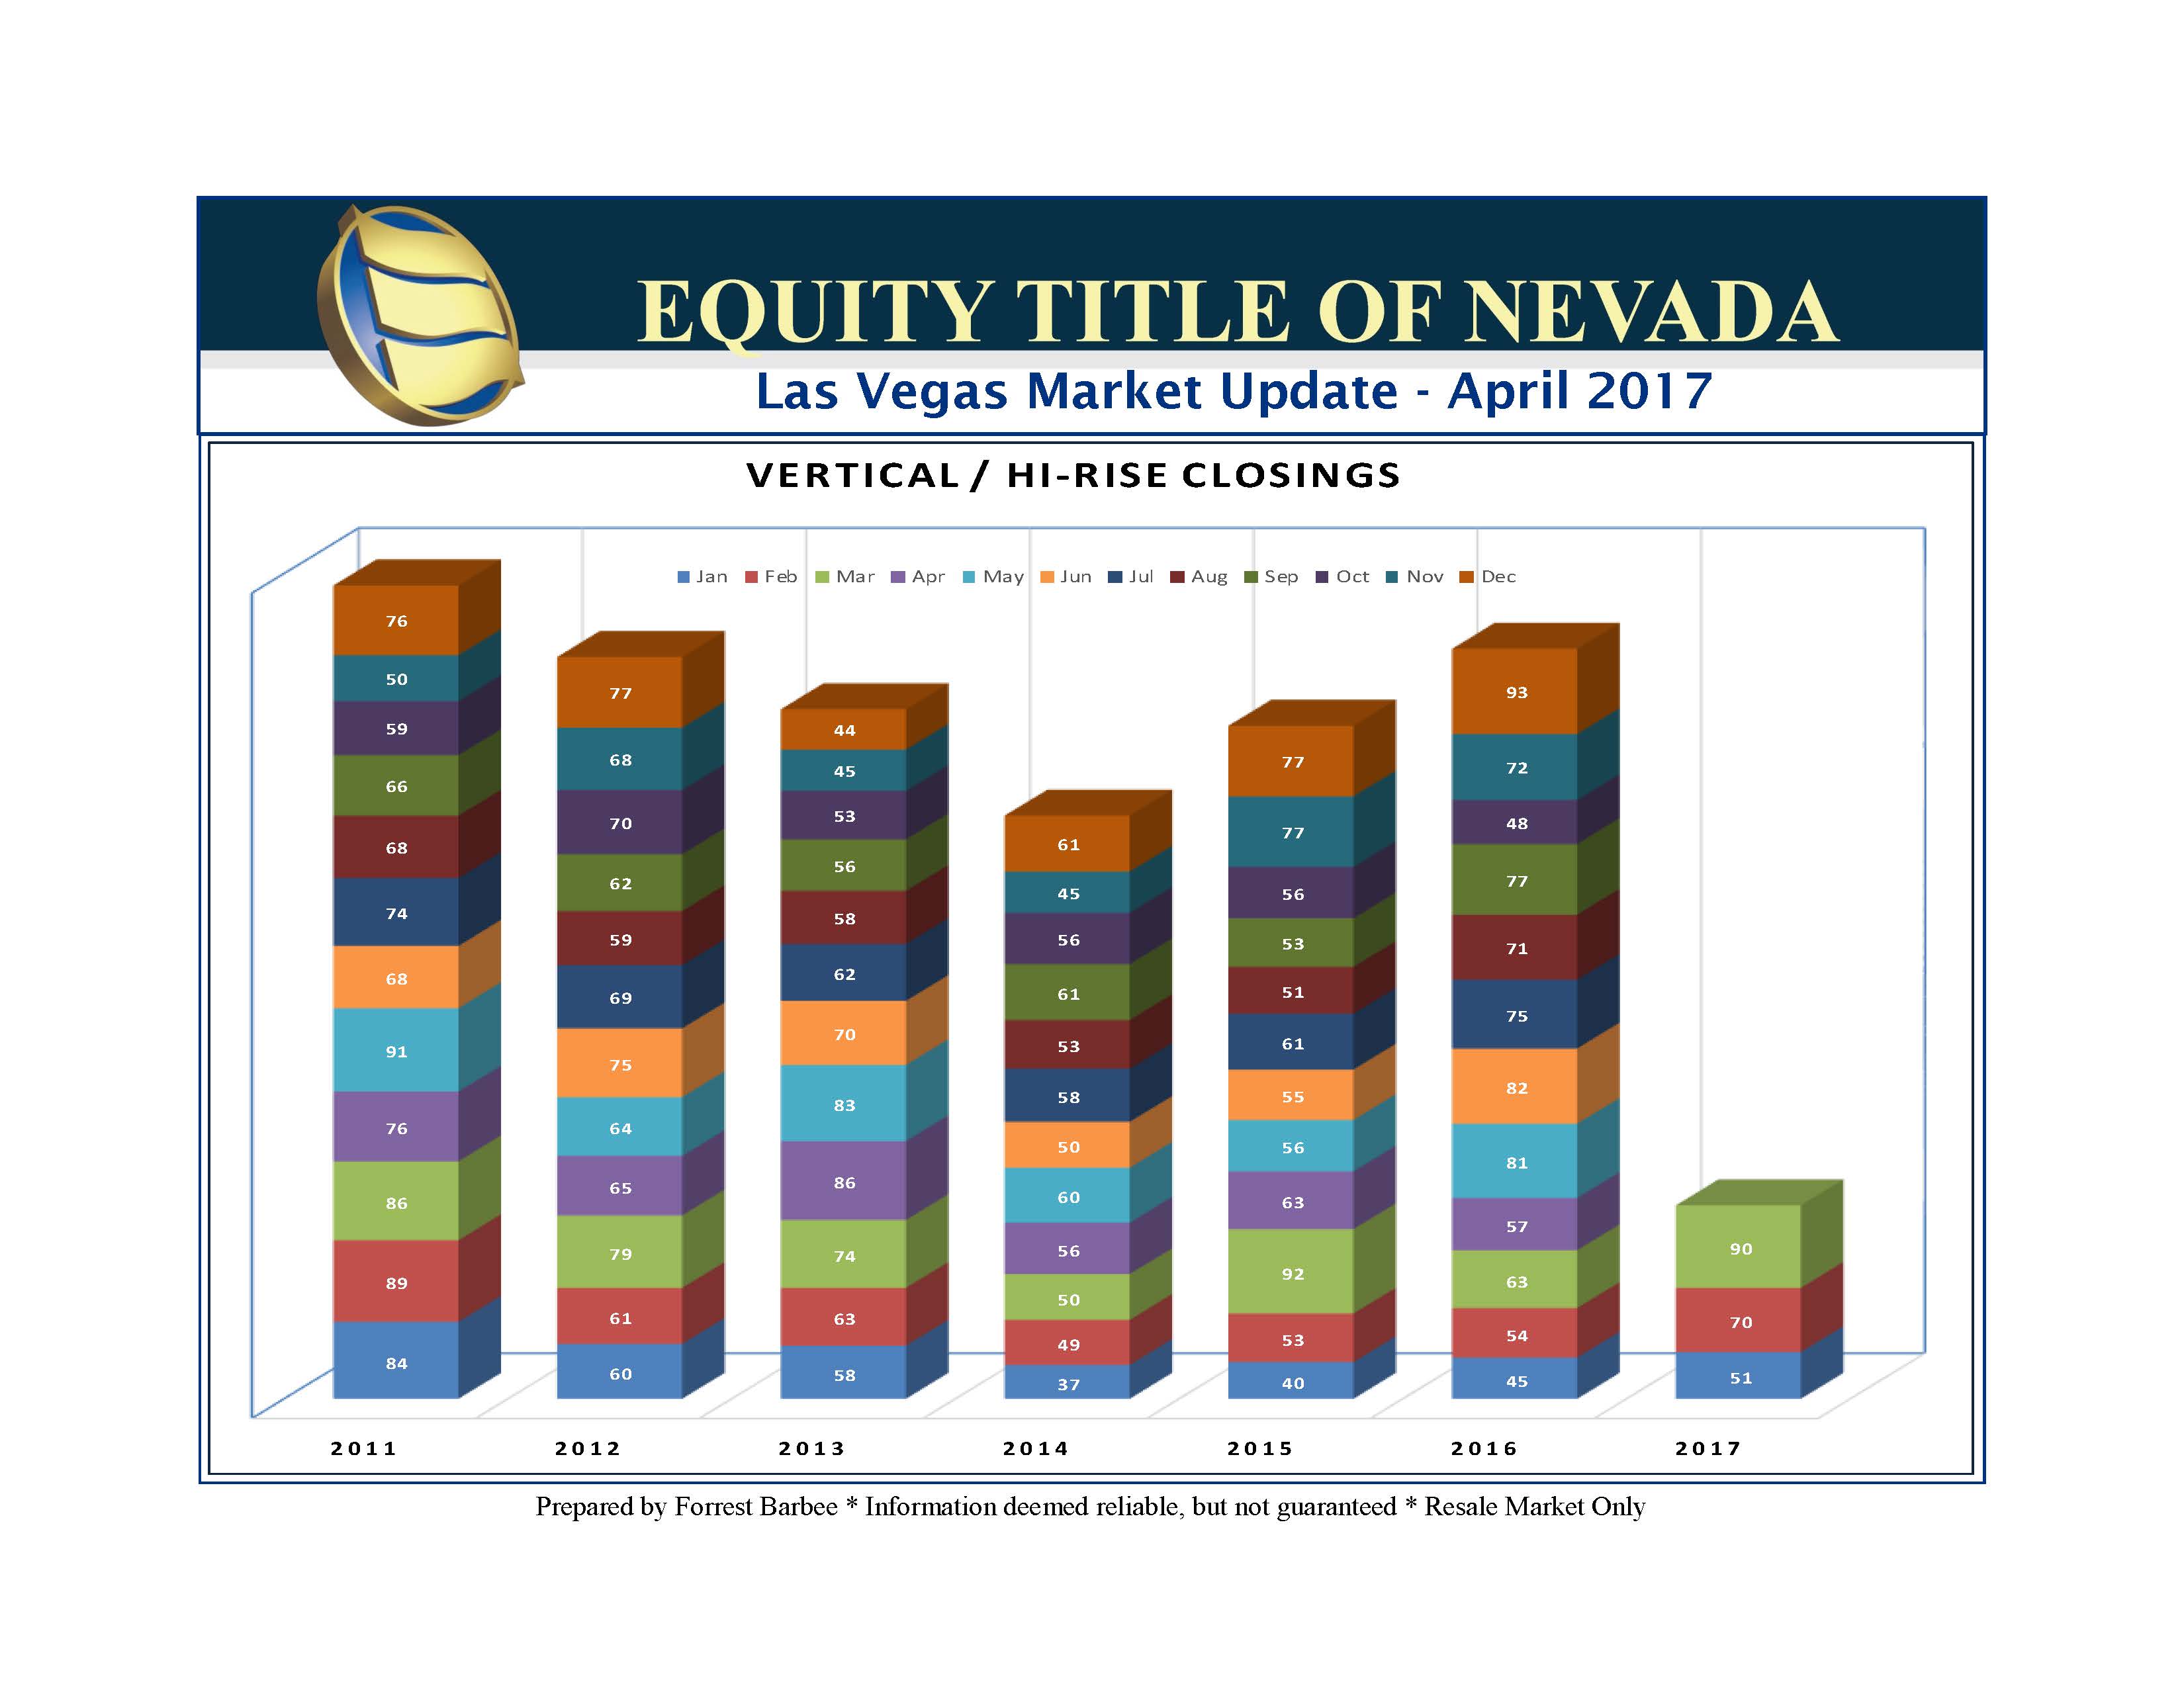
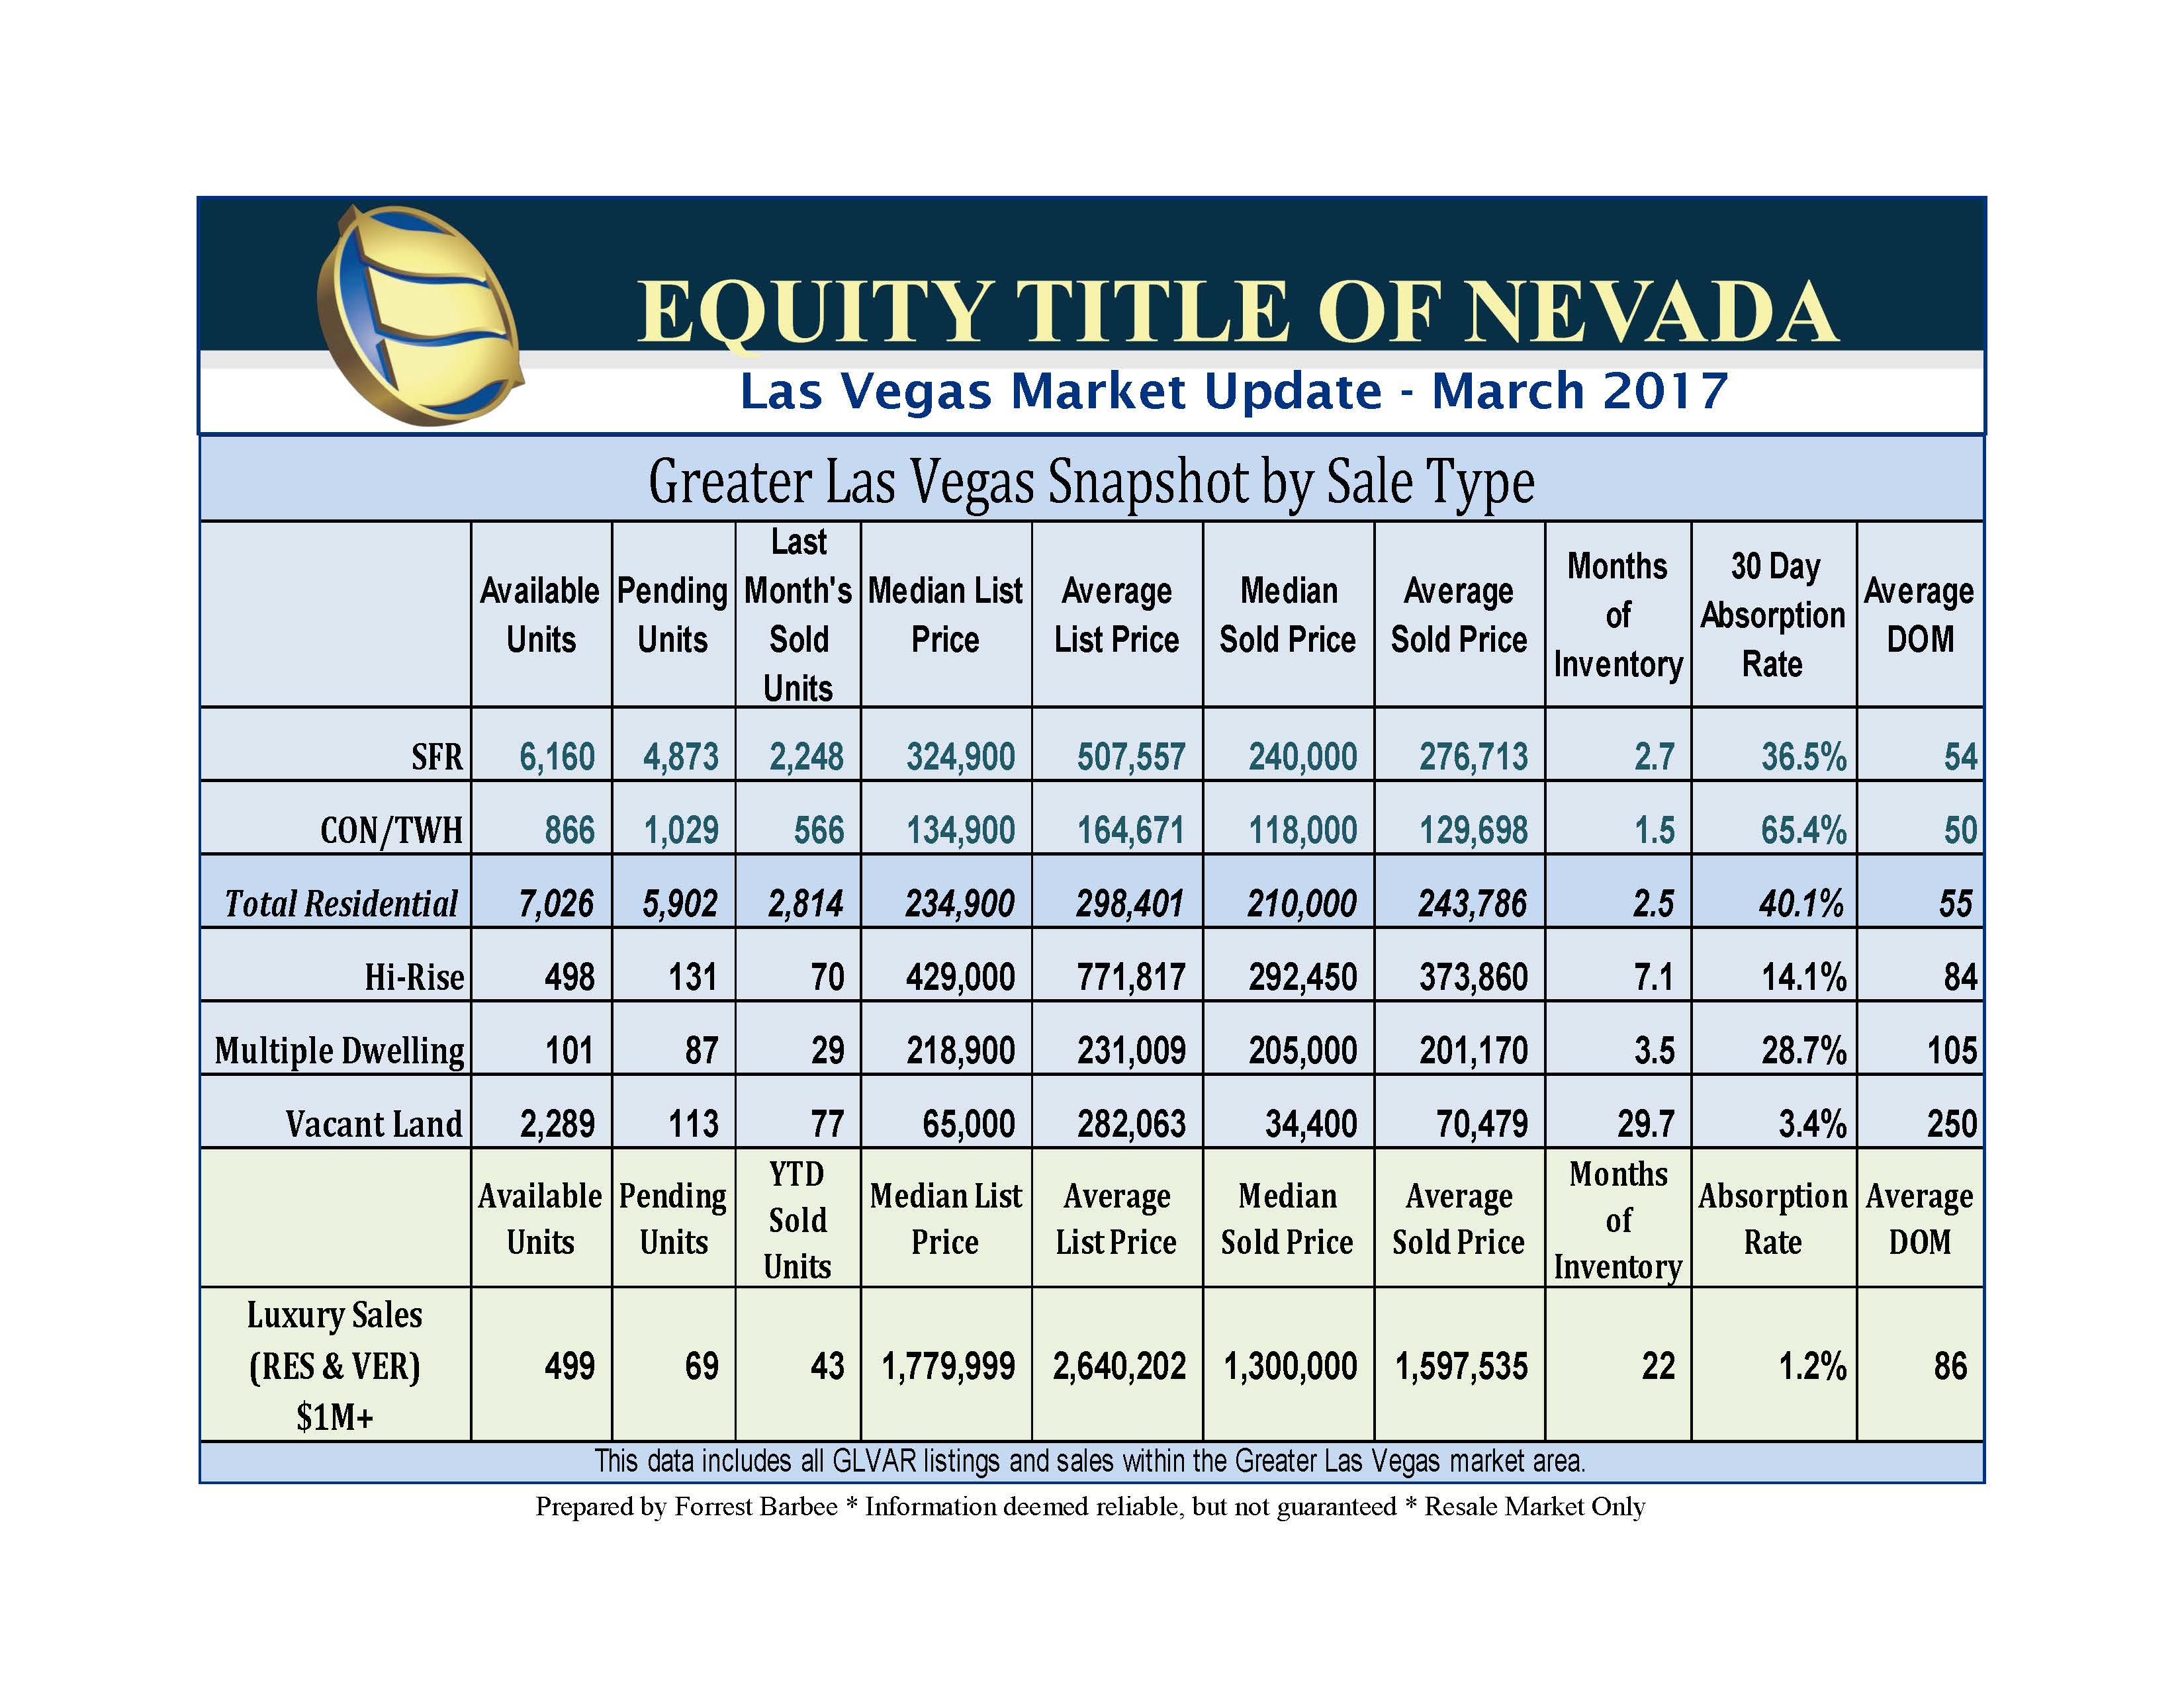
March 2017 Single Family Residential (SFR) closed sales were up 41.5% from February and 13.6% better than March 2016, making it the best March since 2012. Year to date 2017 closed sales are now up 12.3% over 2016. The median closed sales price of a SFR improved 0.83% to $242,000 while the average closed sales price of an SFR also increased by 2.7% to $284,173. Residential resale activity was brisk in March leaving us with less than 3 months of inventory and less than 5900 available SFR listings. All property types participated in the March gains. Condos/Townhomes were up 24.3% over February, while Hi-Rise sales improved by 28.6% and Luxury Sales by 80%


Click Here for the Current Market Update
Click Here for Individual Las Vegas Market Charts
Over Pricing Index
The charts below are an attempt to get a better handle on the current over pricing situation. The charts look at a rolling 12 month average of original listing prices and compares that to a rolling 12 months of closings. It only include SFR data for properties that had an original list price between $250K – $1M in an effort to avoid any skewing from the high end listings (over $1M). The CON/TWN chart includes data for properties has had an original list price below $1M. The rolling 12 month averages provide a smoother trend line than using actual monthly numbers. It looks like we were getting the over pricing under control in the latter part of 2013 and early 2014, but since then the over pricing gap has increased with the average amount of over pricing per SFR being approximately $41,000.
Currently 6% of all available SFR listings have been on the market for over 30 days, 52% over 45 days, and 47% over 60 days. That’s remarkable given there is only 2 to 3 months of available inventory, but with 6% over priced – there is only about 4 weeks of marketable inventory.


