 The Current Las Vegas Market

The operative word for this month is “DOWN”! Closed sales prices dropped, but so did units closed. We are now fully 10% behind 2012 in closed units. And the clock is counting down on the Mortgage Debt Relief Act!
Meanwhile there was not much change in the cash to financing situation except that it is noteworthy that VA closings made up 7% of the November closed sales.
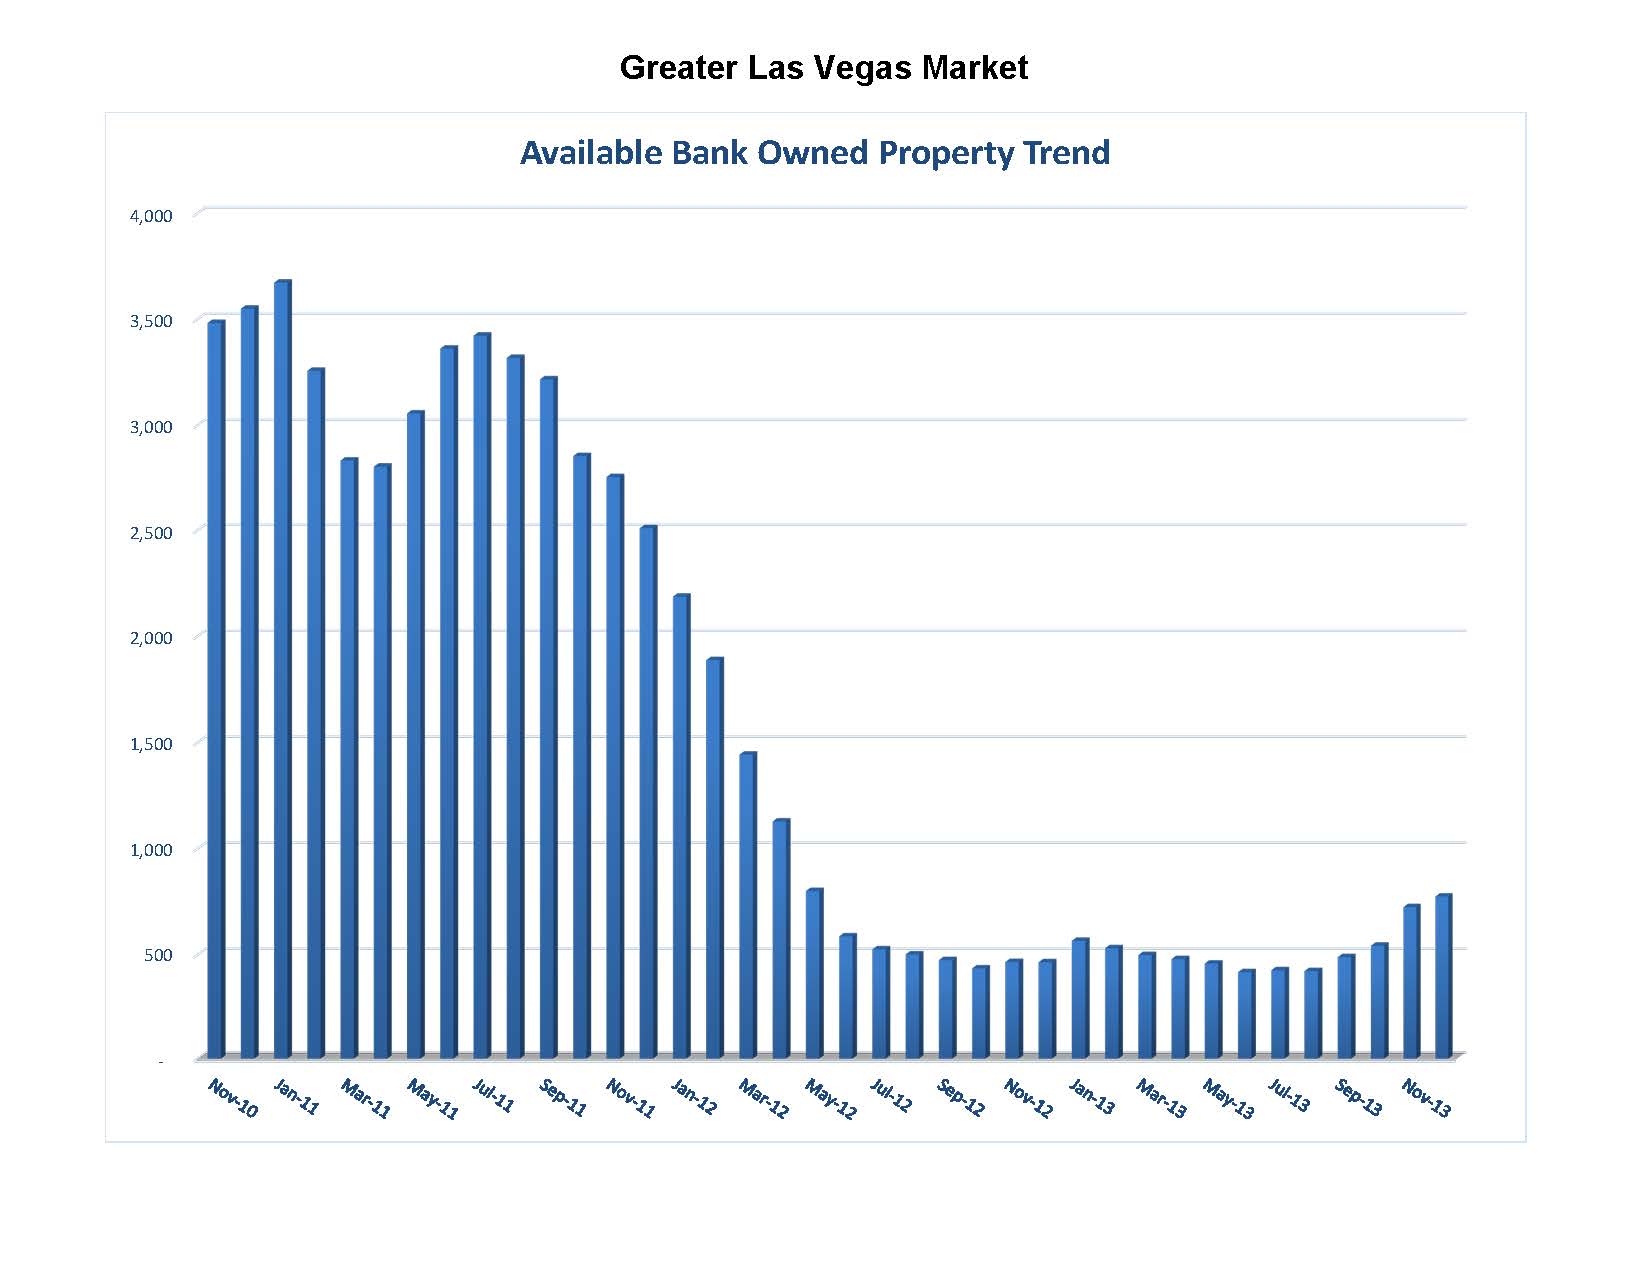
Listings taken dropped dramatically; in fact the rate of decline for November was for worse than the drop in units closed. Therefore, we remain at about 3 month supply inventory for SFR properties while increasing CON/TWH inventory to 4 months. Lastly REO available properties have increased the past two months and should result in an increase of REO closings no later than February.
You may have to change to full screen mode to view properly; otherwise it can be viewed on YouTube here:
Breaking News – New FHA Loan Limits January 1st, 2014
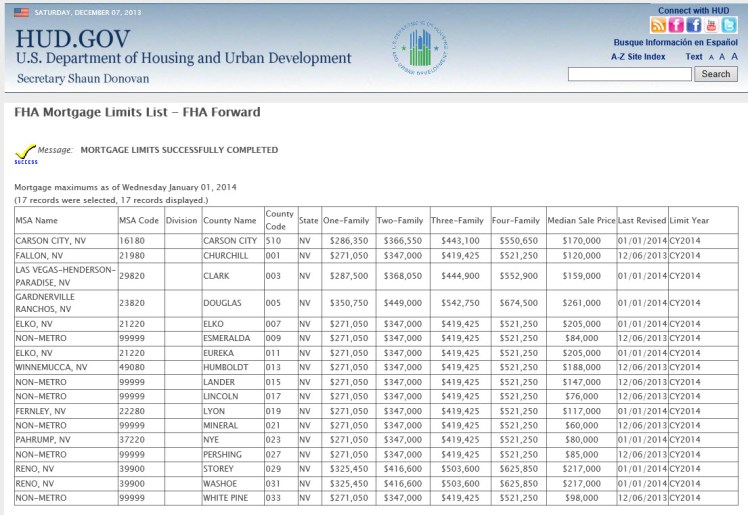
You can click on the image above to download a pdf version of this chart.
Click Here to Download the Current Las Vegas Market Update
Click Here for Additional Market Update Charts
So How Does Phoenix/Scottsdale Compare to Las Vegas?
Just as in Las Vegas, Phoenix experienced a dramatic decrease in closed units even as prices yielded some of their previous gains.
Click Here to Download the Current Phoenix Market Update
Click Here for Additional Phoenix Market Update Charts
What About the REO Market?
The following is provided by Jim Hastings!
As of the second quarter, the Mortgage Bankers Association has indicated the following mortgage delinquencies for the state of Nevada:
|
Loans |
Share/ Rate |
National Rank |
|
| 30 Days |
9,990 |
2.3% |
43 |
| 60 Days |
3,856 |
0.9% |
35 |
| 90 Days + |
18,490 |
4.2% |
2 |
| Foreclosures (in some phase, not foreclosed upon yet) |
22,565 |
5.2% |
6 |
| Total |
54,900 |
12.5% |
3 |
| Total Number of Loans Serviced |
438,149 |
There are 22,565 are in some phase of the foreclosure process, but have yet to be foreclosed upon. There are another 32,000 or so that are past due (30, 60 or 90 days or more), but have yet to commence the foreclosure process. All of these figures exclude bank-owned homes whereby the lender is holding the title. So, when you combine all categories, there is a total of nearly 55,000 homes in Nevada that have loans not being serviced by the borrowers, or 12.5 percent of the total. Unfortunately, the data is only available at the state level. I would argue that about 85 to 90 percent of the homes are located in southern Nevada (that would be +/- 50,000 homes). Also note, this data excludes apartments and other selected product types.
